In [1]:
%matplotlib inline
%load_ext autoreload
%autoreload 2
%load_ext line_profiler
In [ ]:
import scanpy as sc
from scipy.io import mmread
import random
import pandas as pd

import src.scanpy_unicoord as scu
import torch
from src.visualization import *
from line_profiler import LineProfiler
import imageio
In [ ]:
sc.settings.verbosity = 3             # verbosity: errors (0), warnings (1), info (2), hints (3)
sc.logging.print_header()
# sc.settings.set_figure_params(dpi=80, facecolor='white')
sc.settings.set_figure_params(vector_friendly=False)
load data
In [ ]:
adata = sc.read_h5ad(r'D:\hECA\Lung.Adult.pp.h5ad')
In [ ]:
adata = adata.raw.to_adata()
sc.pp.normalize_total(adata, target_sum=1e4 ,exclude_highly_expressed= True)
sc.pp.log1p(adata)
adata
model
In [ ]:
scu.model_unicoord_in_adata(adata, n_cont=50, n_diff=0, n_clus = [],
                            obs_fitting=['cell_type','seq_tech'])
In [ ]:
scu.train_unicoord_in_adata(adata, epochs=10, chunk_size=20000, slot = "cur")
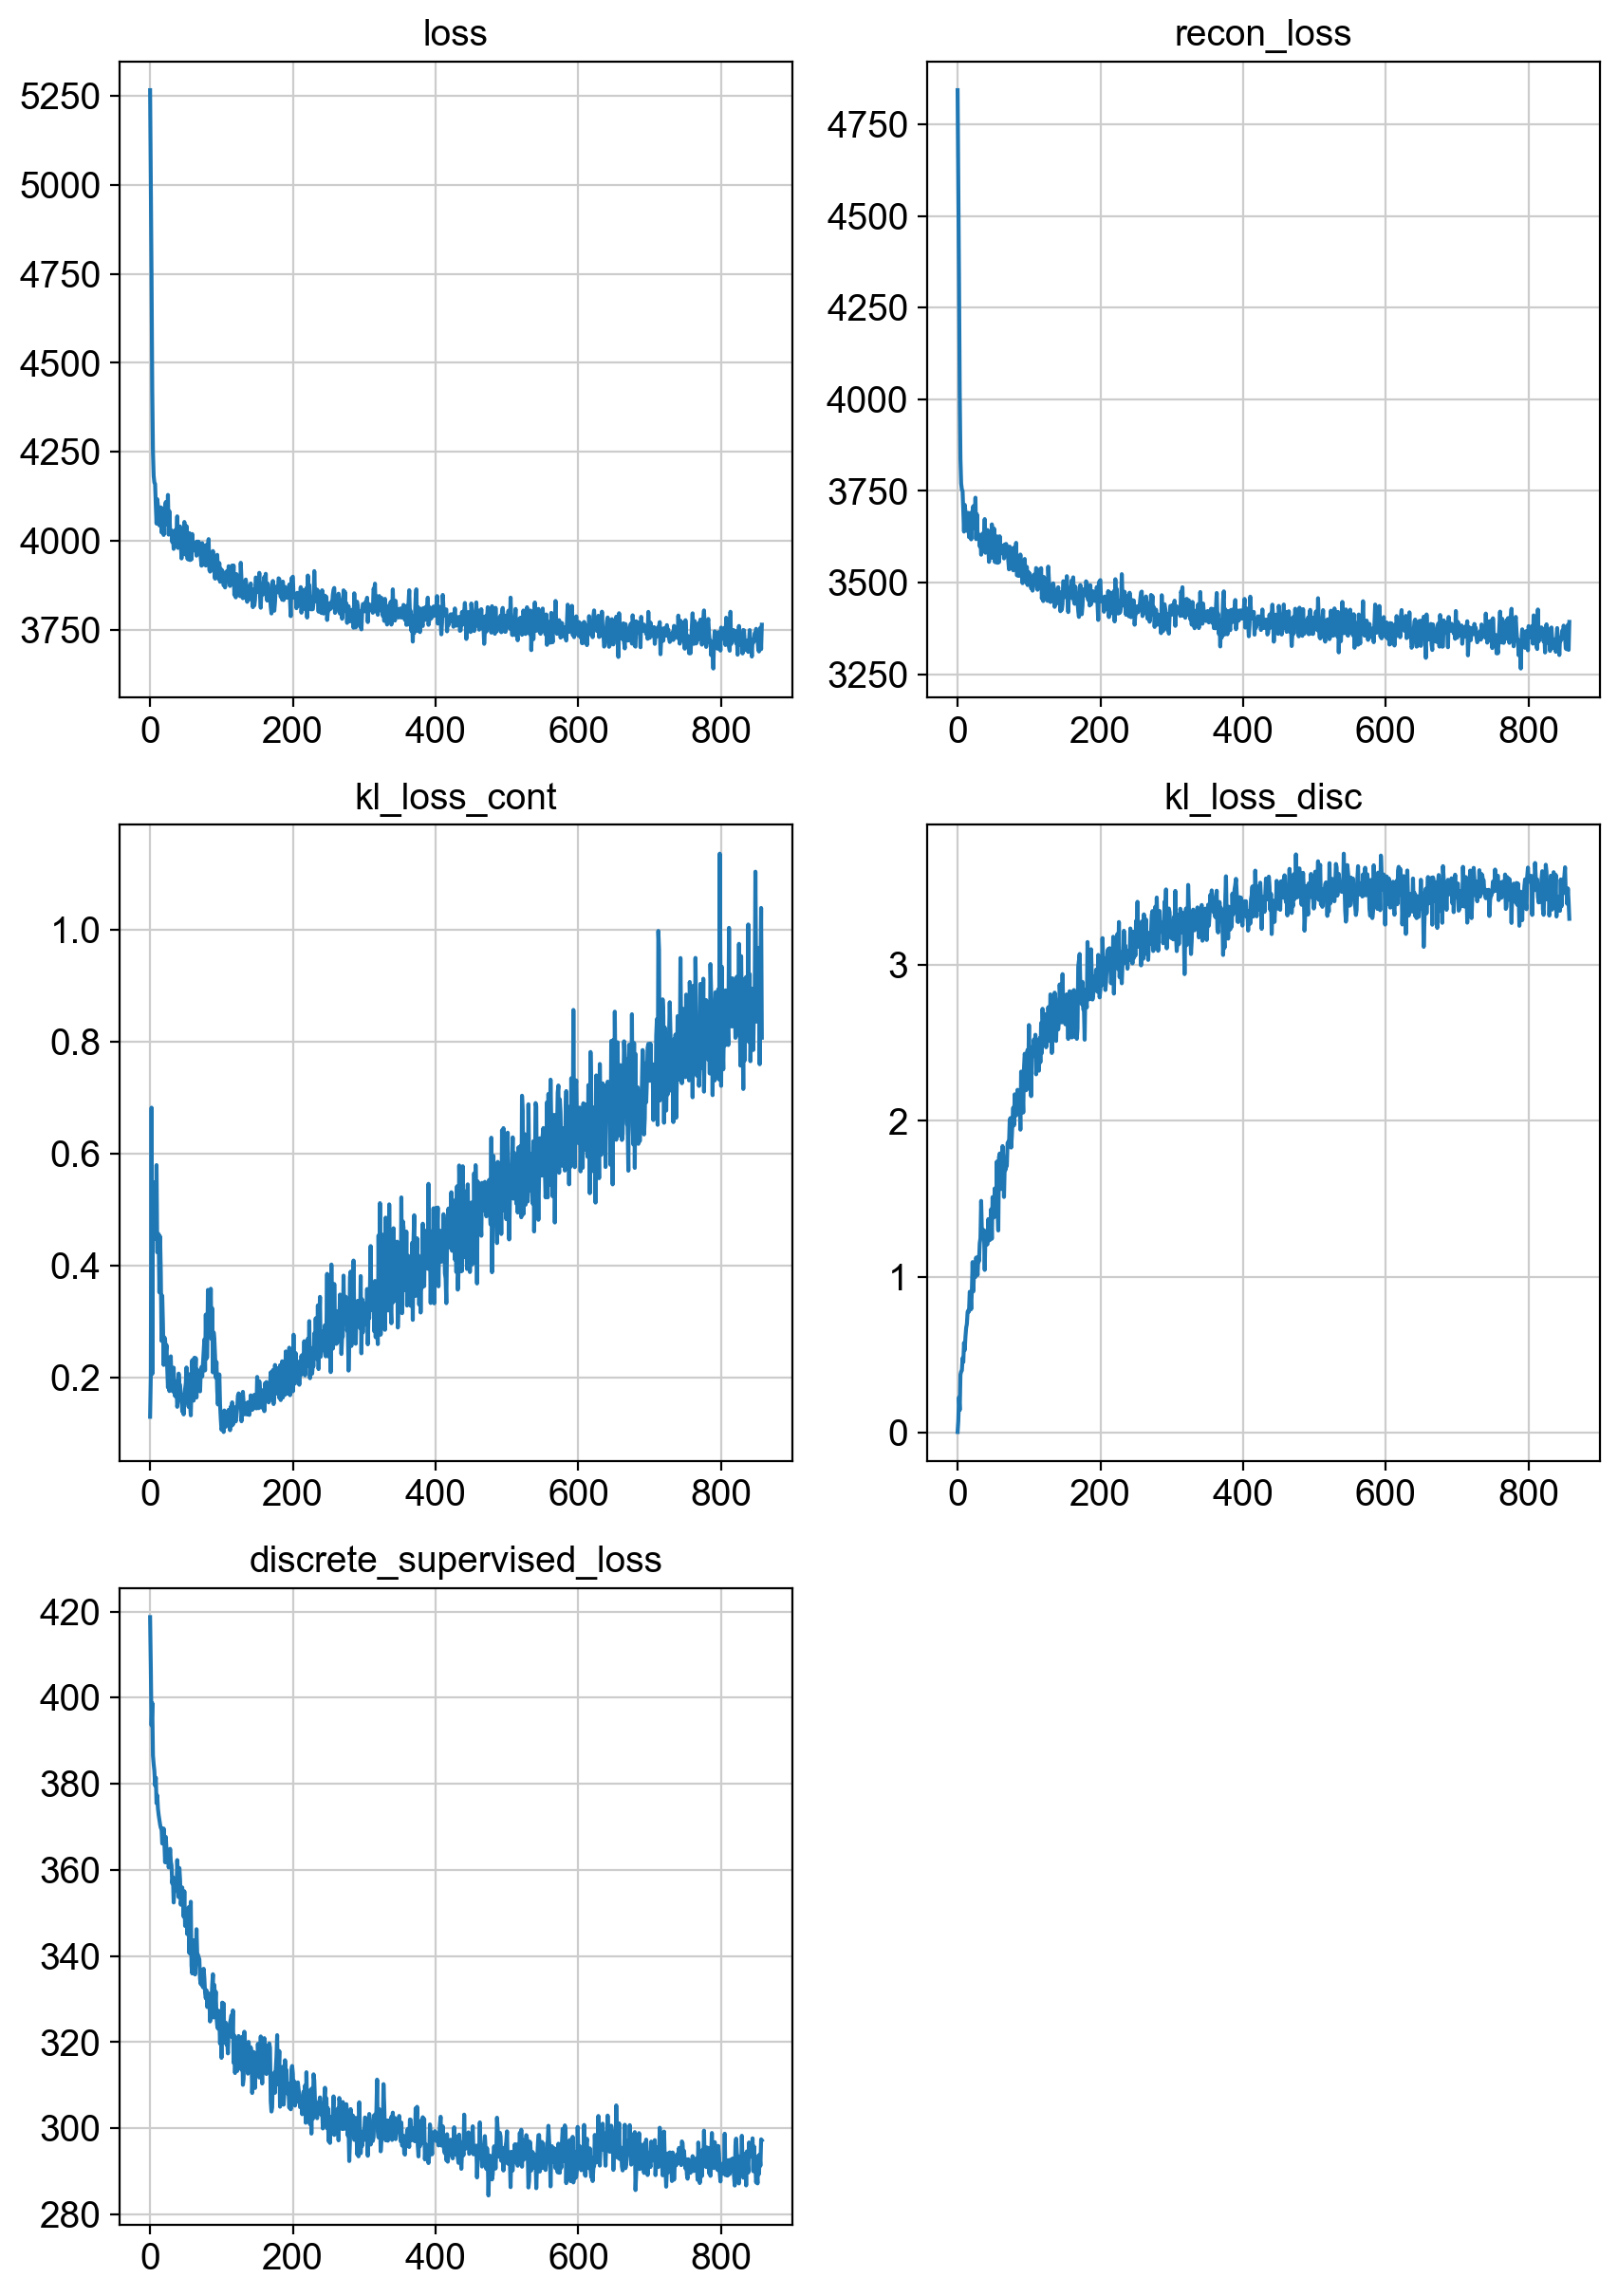
In [16]:
fig = draw_loss_curves(adata.uns['unc_stuffs']['trainer'].losses)
# if save_figs:
#     fig.savefig(os.path.join(savePath, 'img', 'fig1_lossCurves.png'))
fig.show()
generation
In [21]:
bdata = scu.generate_unicoord_in_adata(adata[random.sample(list(adata.obs_names),10000),:],
                                       chunk_size=5000)
bdata
Out[21]:
In [25]:
bdata.obs_names[0][:-4]
Out[25]:
In [29]:
map(lambda x:x[:-4], ['12345','234125','342315'])
Out[29]:
In [30]:
bdata.obsm['X_umap'] = adata[list(map(lambda x:x[:-4],bdata.obs_names)),:].obsm['X_umap']
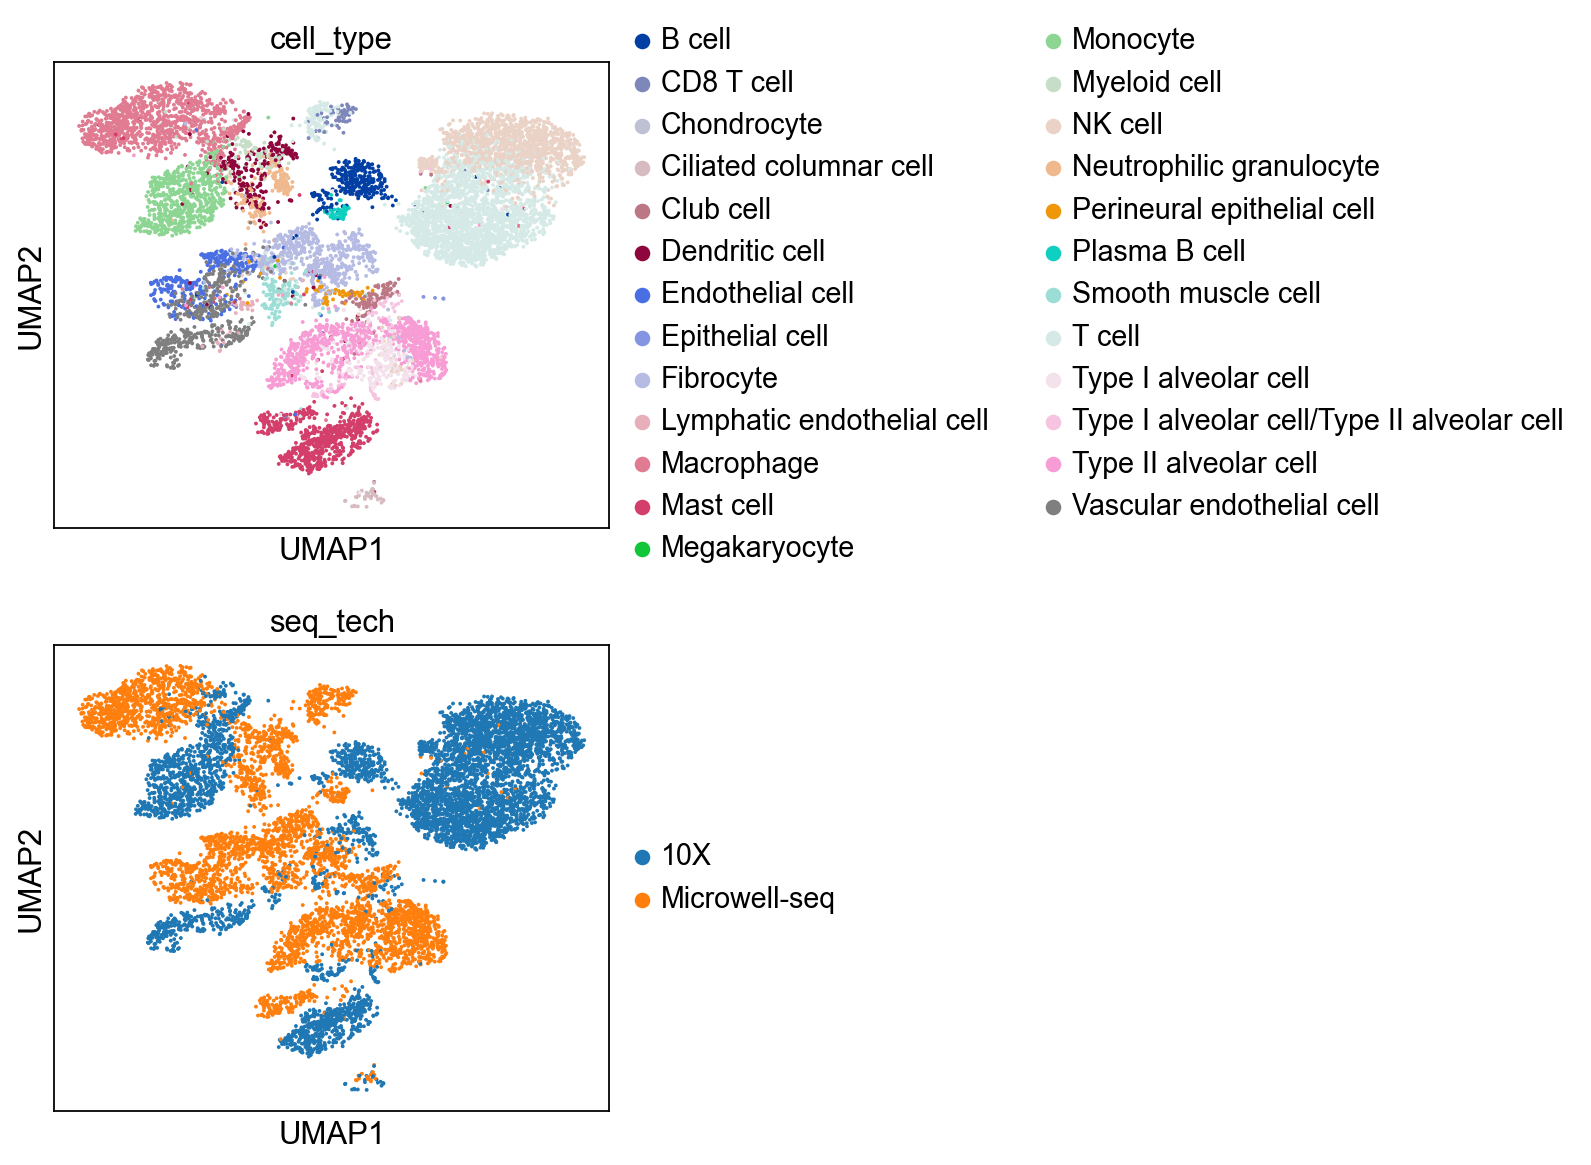
In [31]:
sc.pl.umap(bdata, color=['cell_type','seq_tech'],
           ncols = 1)
In [32]:
# bdata = bdata.raw.to_adata()
scu.predcit_unicoord_in_adata(bdata,adata)
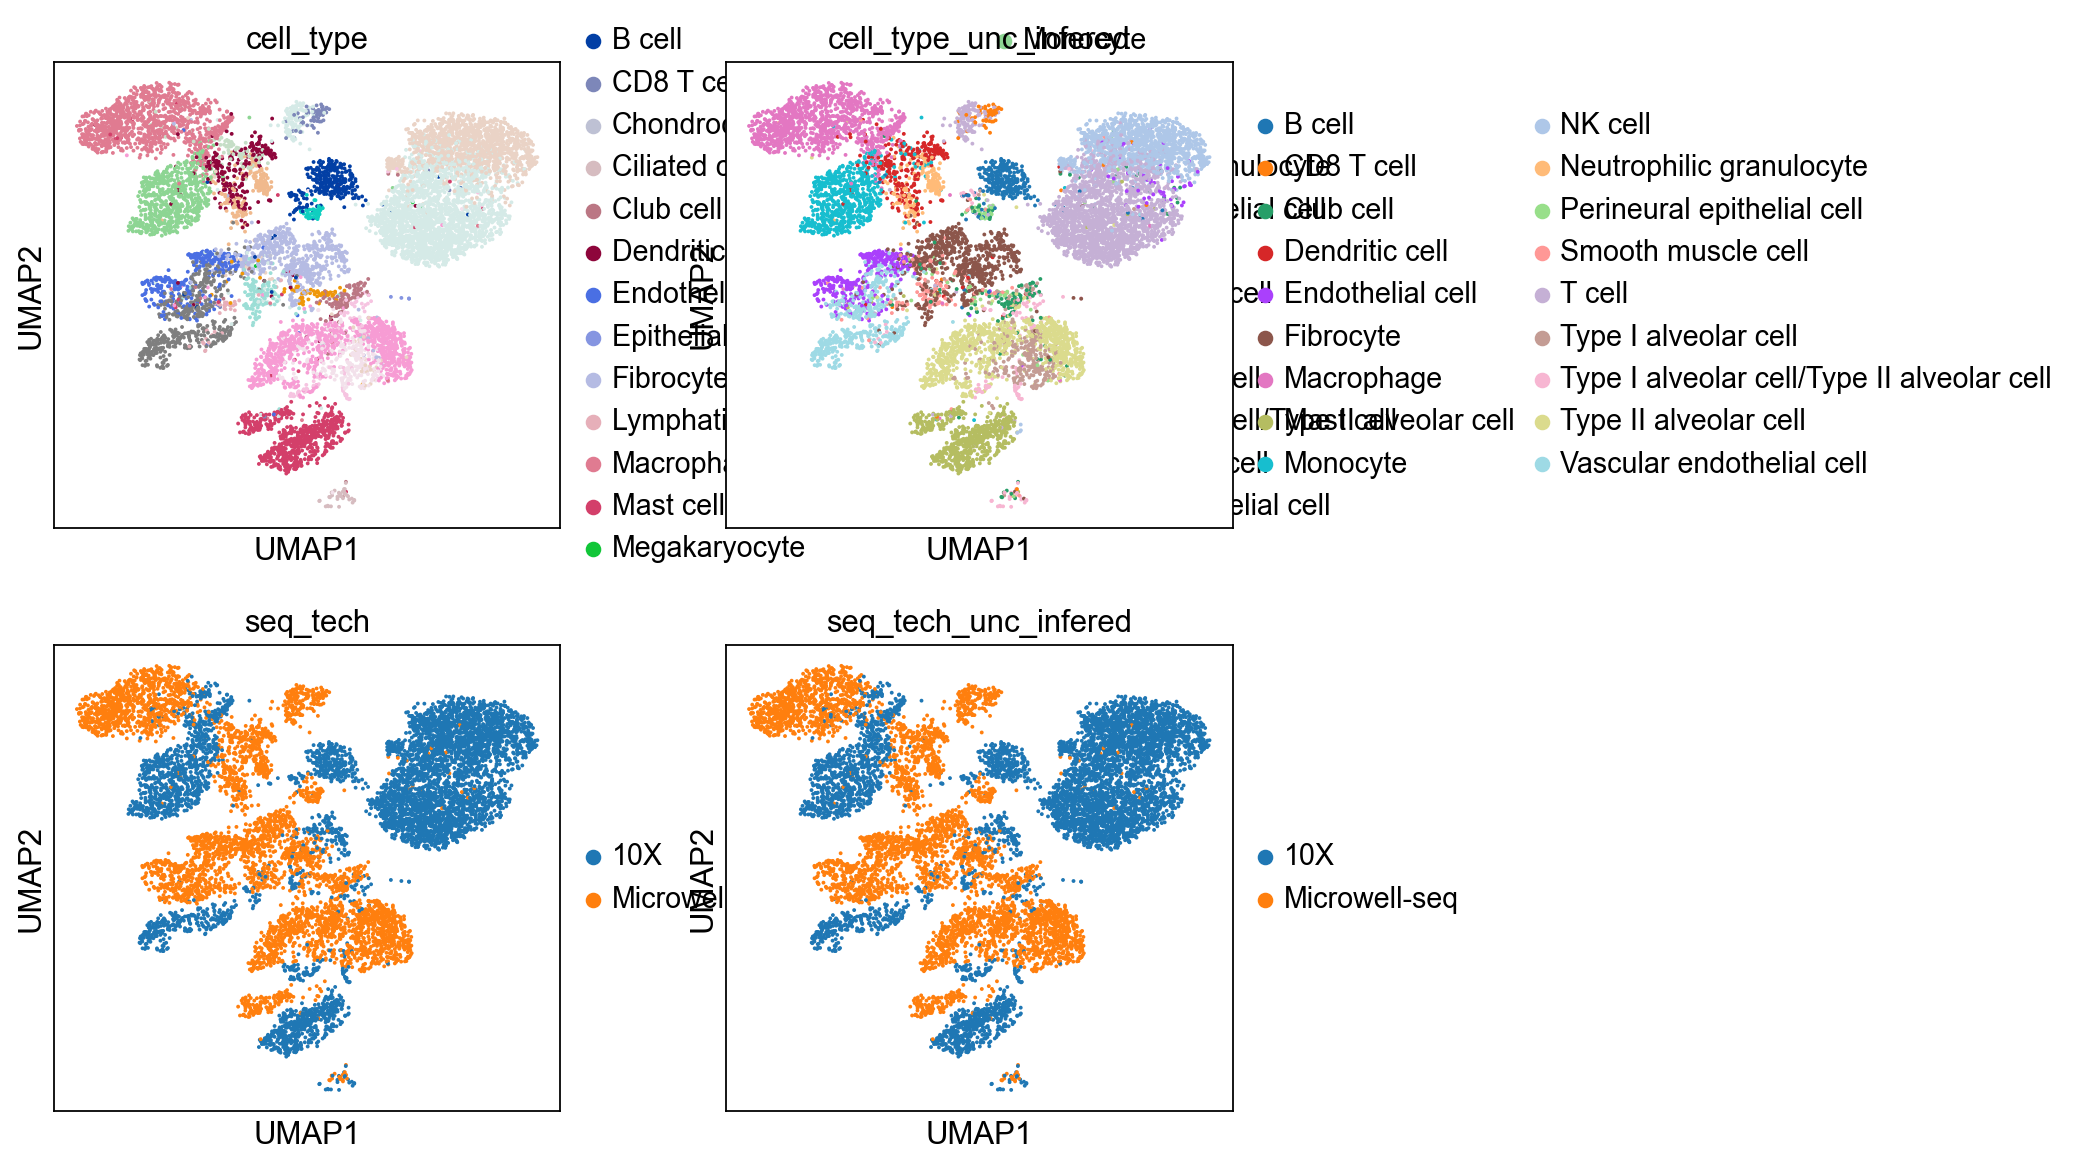
In [33]:
sc.pl.umap(bdata, color=['cell_type','cell_type_unc_infered',
                         'seq_tech','seq_tech_unc_infered'],
           ncols = 2)
set seq tech
In [34]:
from src.utils import pairwise_distances
def find_nearest_neighbors(query, ref, genes):
    gquery = query[:,genes].X
    gref = ref[:,genes].X
    dis = pairwise_distances(torch.FloatTensor(gquery), torch.FloatTensor(gref))
    return np.array(np.argmin(dis, axis = 1))
In [36]:
import itertools
cells = list(itertools.chain(*[random.sample(list(adata.obs_names[adata.obs.seq_tech==ct]), 2000) \
                               for ct in adata.obs.seq_tech.value_counts().index]))
In [38]:
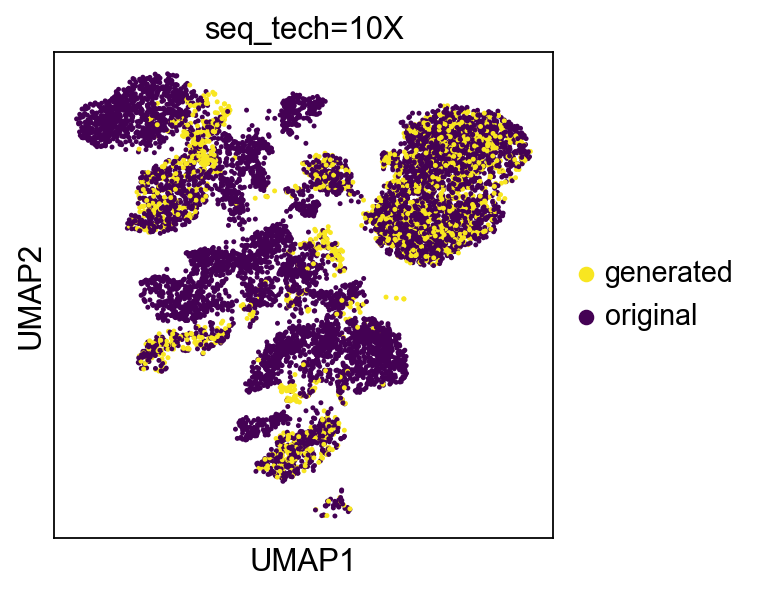
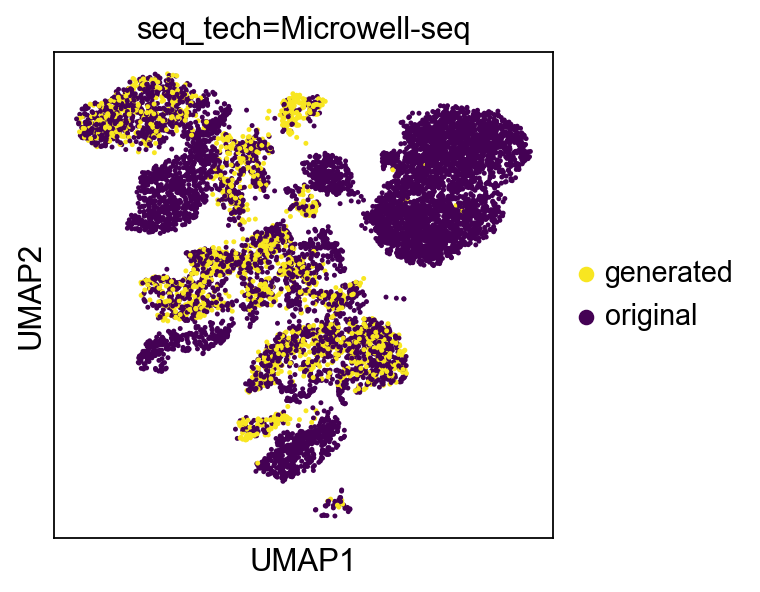
def create_figs(set_value, title):
    cdata = scu.generate_unicoord_in_adata(adata[cells,:].copy(),adata,
                                       set_value=set_value)
    nn = find_nearest_neighbors(cdata,bdata, bdata.var_names)
    gen = pd.Series(['original']*len(bdata))
    gen[np.unique(nn)] = 'generated'
    gen = gen.astype('category')
    gen.index = bdata.obs_names
    bdata.obs['gen'] = gen
    bdata.uns['gen_colors'] = ['#F8E621','#440154']
    f = sc.pl.umap(bdata, color=['gen'], return_fig=True, s=20, title=title)
    return f
In [45]:
images = [create_figs({'seq_tech':t}, 'seq_tech=%s'%(t))\
          for t in bdata.obs.seq_tech.value_counts().index]
In [46]:
import os
In [47]:
gif = []
for f in images:
    f.savefig('./tmp.png')
    gif.append(imageio.imread('./tmp.png'))
    os.remove('./tmp.png')
In [51]:
imageio.mimsave('./hECALung_generation_seq_tech.gif', gif, duration = 0.5)
merge batch
In [57]:
cdata = scu.generate_unicoord_in_adata(adata,
                                       set_value={'seq_tech':"10X"})
In [58]:
cdata
Out[58]:
In [59]:
sc.pp.normalize_total(cdata)
sc.pp.log1p(cdata)
sc.pp.highly_variable_genes(cdata)
cdata.raw = cdata
cdata = cdata[:, cdata.var.highly_variable]
sc.pp.scale(cdata)
sc.tl.pca(cdata)
sc.pp.neighbors(cdata)
sc.tl.leiden(cdata)
sc.tl.umap(cdata)
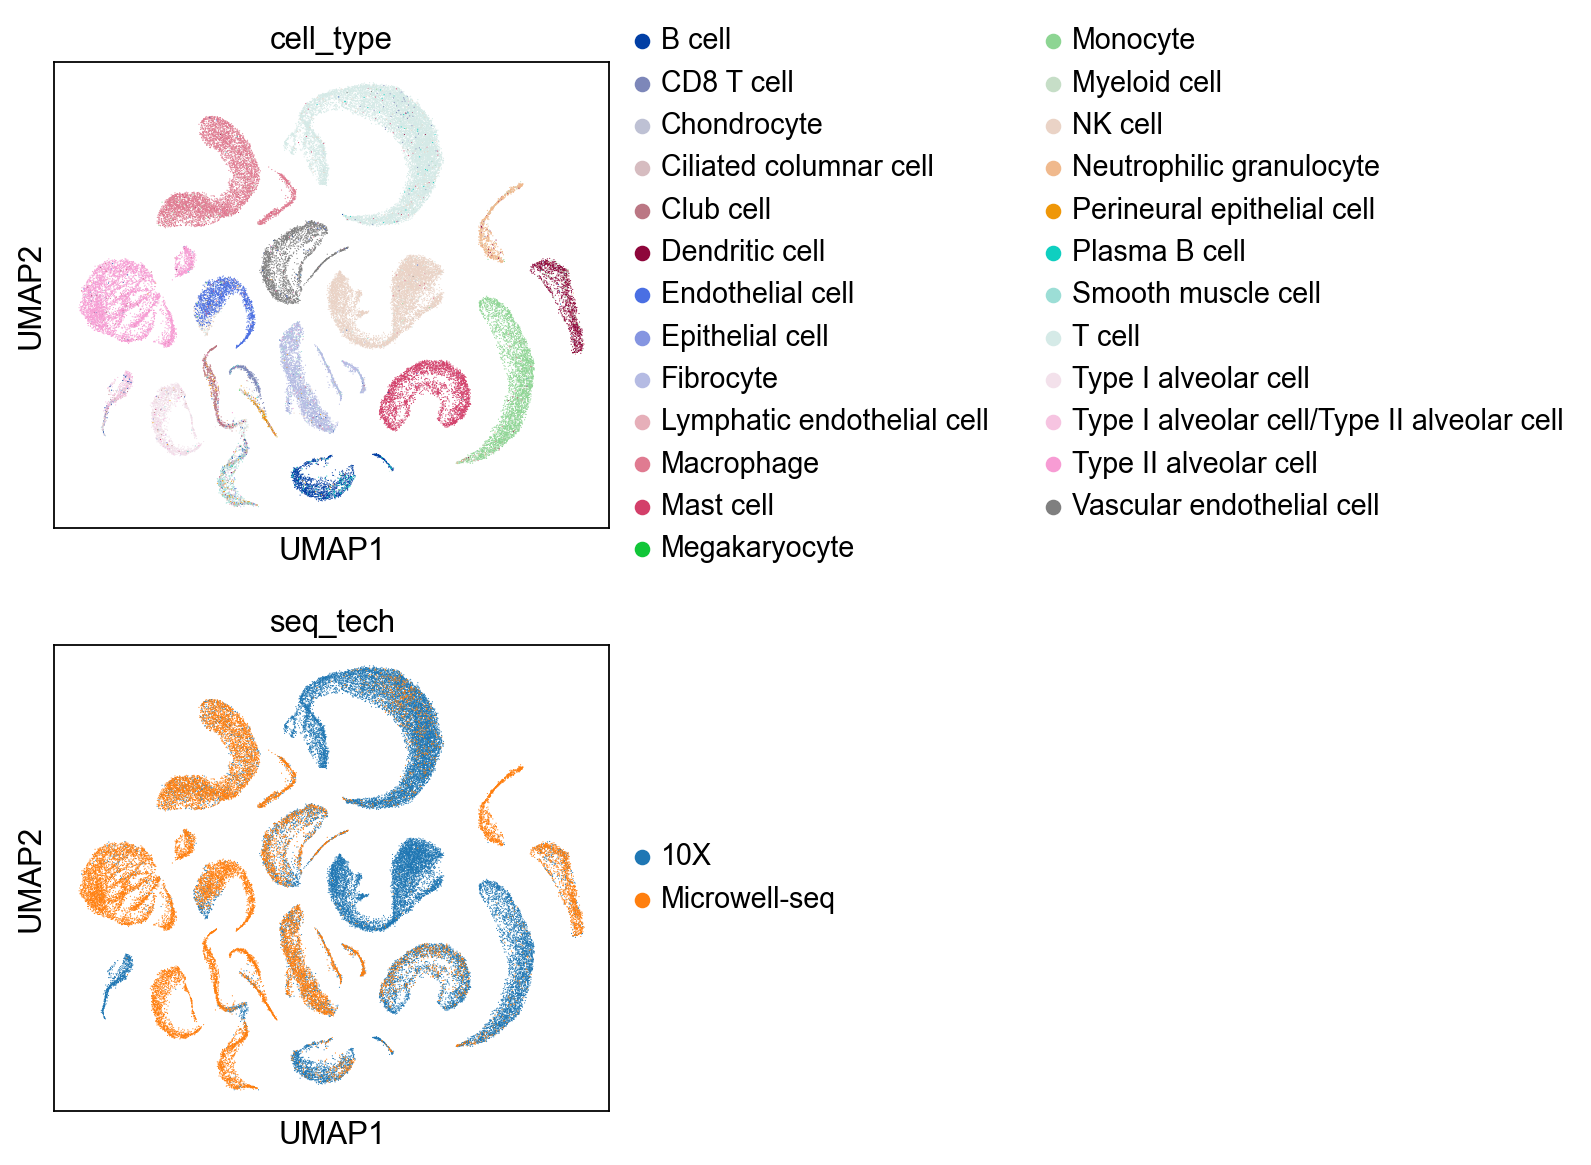
In [61]:
sc.pl.umap(cdata, color=['cell_type','seq_tech'], s = 1,
           ncols = 1)
In [62]:
ct_mapping = {"Type I alveolar cell" : "Epithelial cells",
"Type I alveolar cell/Type II alveolar cell" : "Epithelial cells",
"Type II alveolar cell" : "Epithelial cells",
"Club cell" : "Epithelial cells",
"Ciliated columnar cell" : "Epithelial cells",
"Perineural epithelial cell" : "Epithelial cells",
"Epithelial cell" : "Epithelial cells",
"Lymphatic endothelial cell" : "Endothelial cells",
"Vascular endothelial cell" : "Endothelial cells",
"Endothelial cell" : "Endothelial cells",
"Fibrocyte" : "Fibroblasts",
"Smooth muscle cell" : "Fibroblasts",
"Dendritic cell" : "Myeloid cells",
"Macrophage" : "Myeloid cells",
"Monocyte" : "Myeloid cells",
"Neutrophilic granulocyte" : "Myeloid cells",
"Myeloid cell" : "Myeloid cells",
"Mast cell" : "MAST cells",
"NK cell" : "T/NK cells",
"T cell" : "T/NK cells",
"CD8 T cell" : "T/NK cells",
"B cell" : "B lymphocytes",
"Plasma B cell" : "B lymphocytes",
"Chondrocyte" : "rare types",
"Megakaryocyte" : "rare types"}
In [66]:
adata.obs['cell_types_refined'] = [ct_mapping[c] if c in ct_mapping else "rare types" for c in adata.obs['cell_type']]
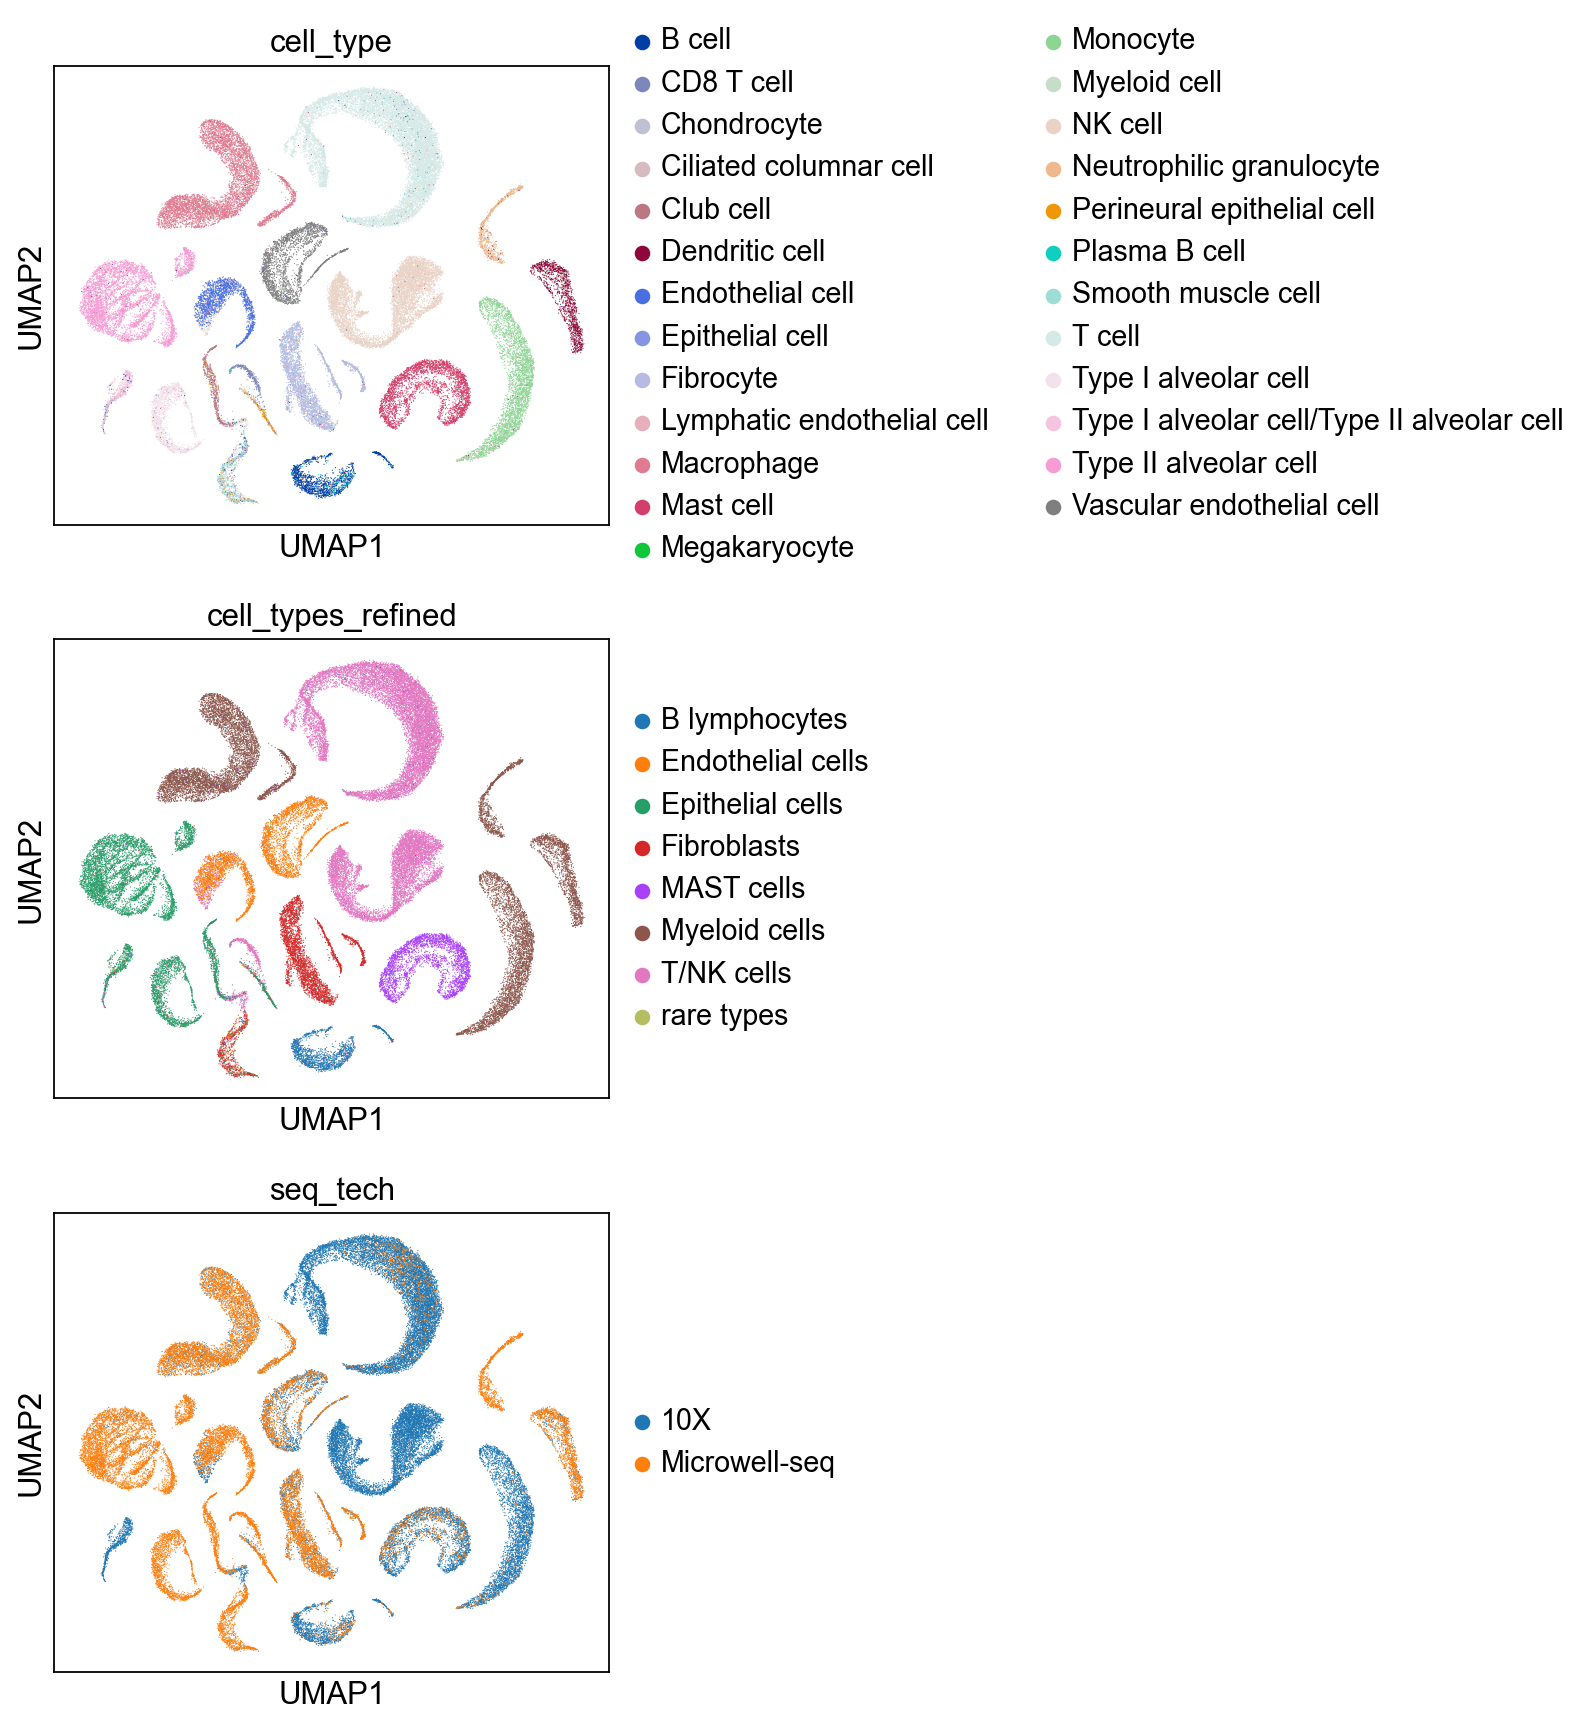
In [78]:
sc.pl.umap(adata, color=['cell_type','cell_types_refined','seq_tech'],
           ncols = 1)
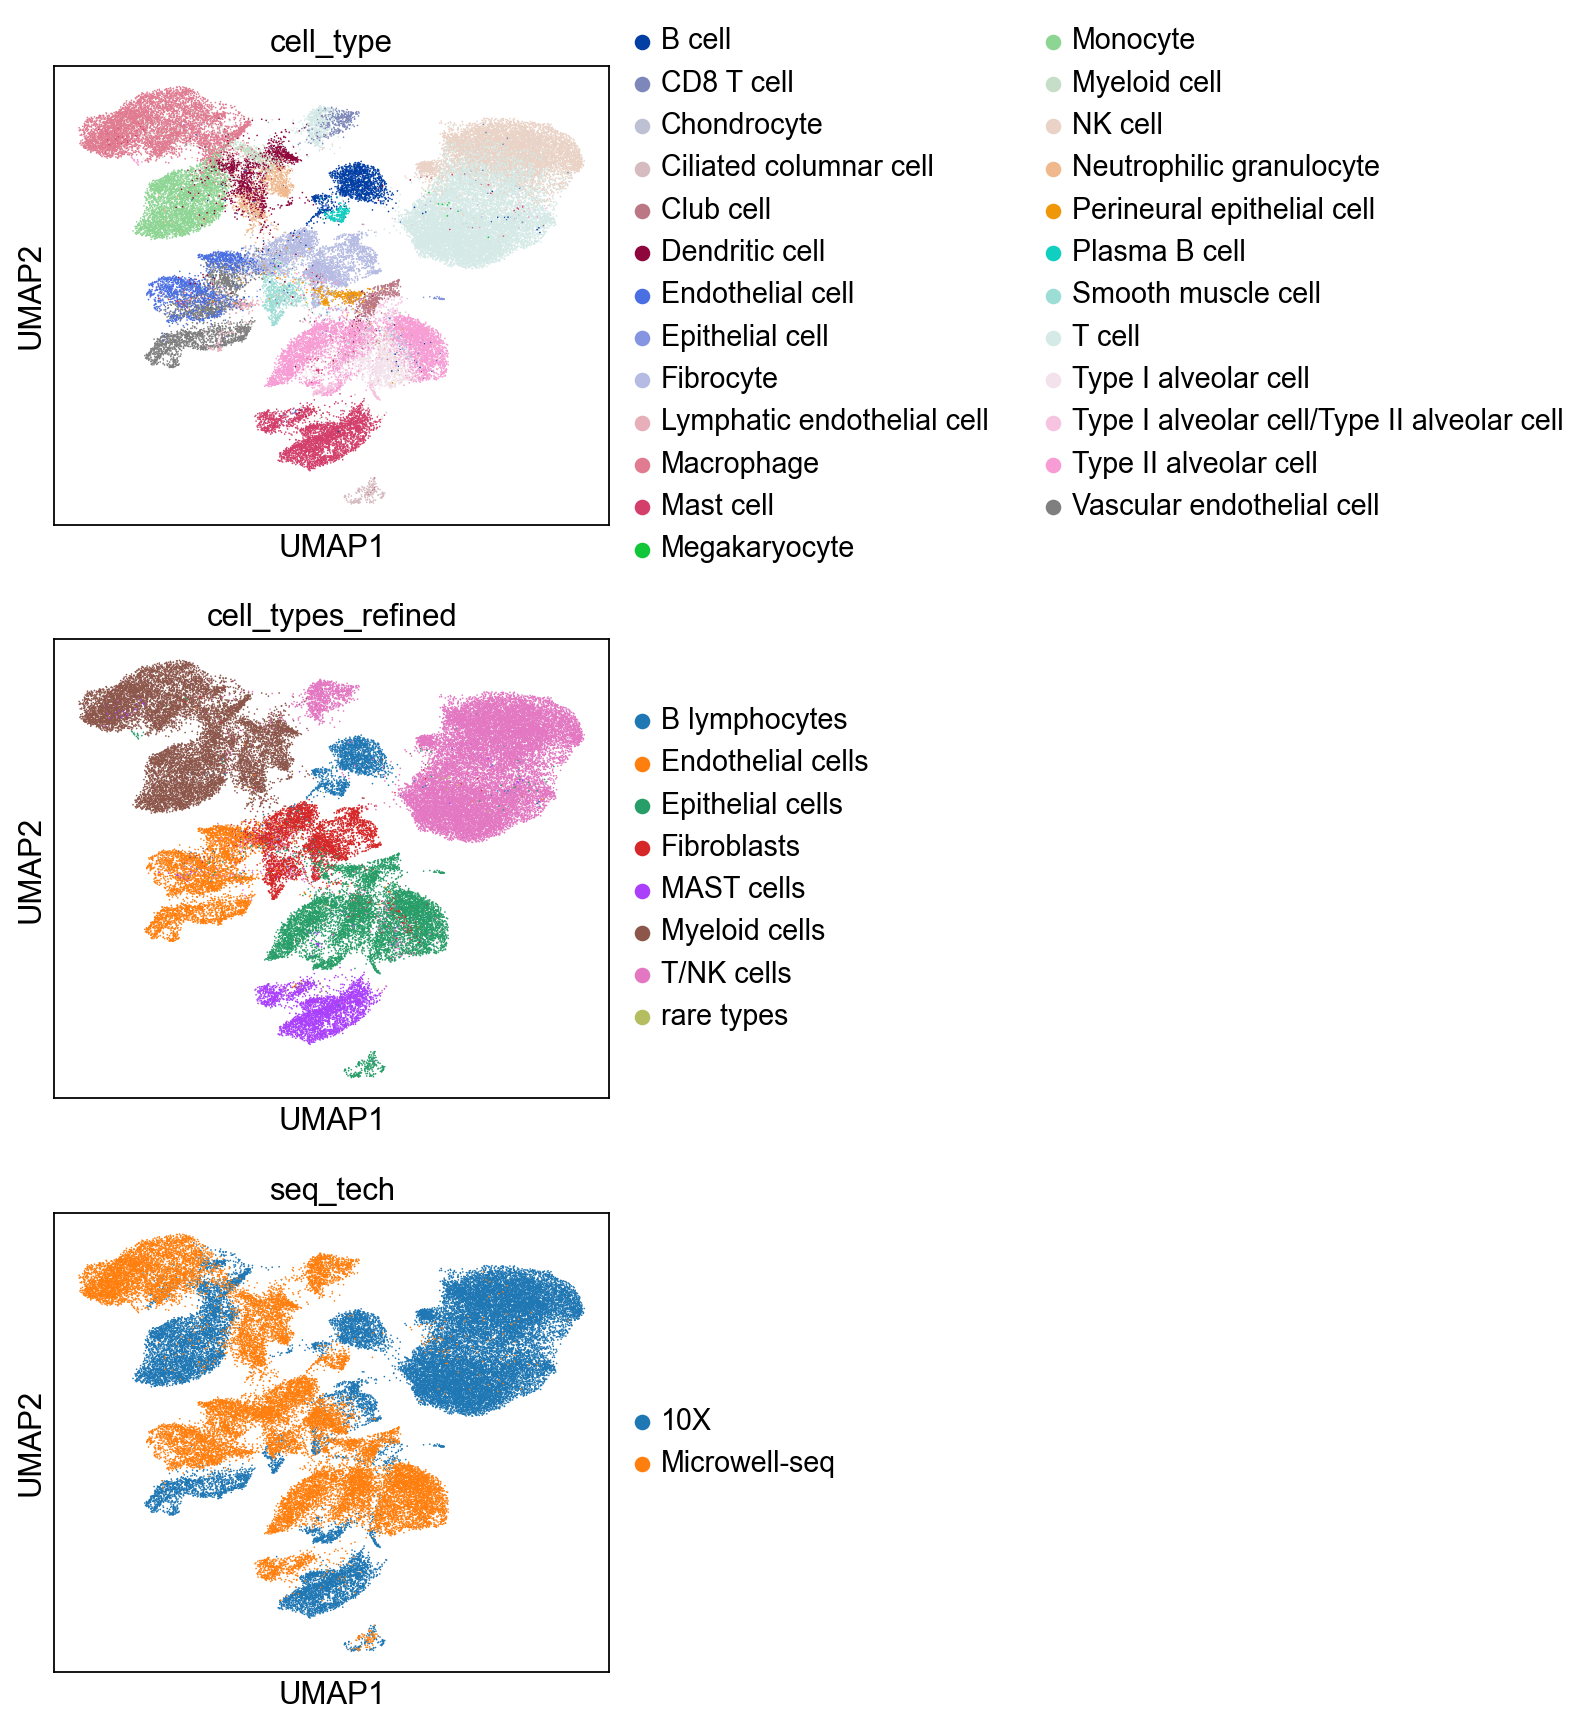
In [72]:
cdata.obs['cell_types_refined'] = list(adata.obs['cell_types_refined'])
In [79]:
sc.pl.umap(cdata, color=['cell_type','cell_types_refined','seq_tech'], s = 1,
           ncols = 1)