In [1]:
%matplotlib inline
%load_ext autoreload
%autoreload 2
In [2]:
import scanpy as sc
import random
from unicoord import scu
from unicoord.visualization import draw_loss_curves
import torch
from line_profiler import LineProfiler
In [3]:
sc.settings.verbosity = 3             # verbosity: errors (0), warnings (1), info (2), hints (3)
sc.logging.print_header()
# sc.settings.set_figure_params(dpi=80, facecolor='white')
sc.settings.set_figure_params(vector_friendly=False)
load LUAD data
In [4]:
adata = sc.read_h5ad(r"D:\hECA\Lung_cancer.pp.h5ad")
adata
Out[4]:
In [5]:
adata = adata.raw.to_adata()
sc.pp.normalize_total(adata, target_sum=1e4 ,exclude_highly_expressed= True)
sc.pp.log1p(adata)
adata
Out[5]:
In [6]:
adata = adata[adata.obs['Cell_type.refined']!='NA',:].copy()
adata
Out[6]:
model and training
In [16]:
scu.model_unicoord_in_adata(adata, n_diff=0, n_clus=[], n_cont=5,
                            obs_fitting=['Cell_type.refined', 'Cell_subtype','Sample'])
In [13]:
scu.train_unicoord_in_adata(adata, epochs=10, slot = 'cur', chunk_size=20000)
In [42]:
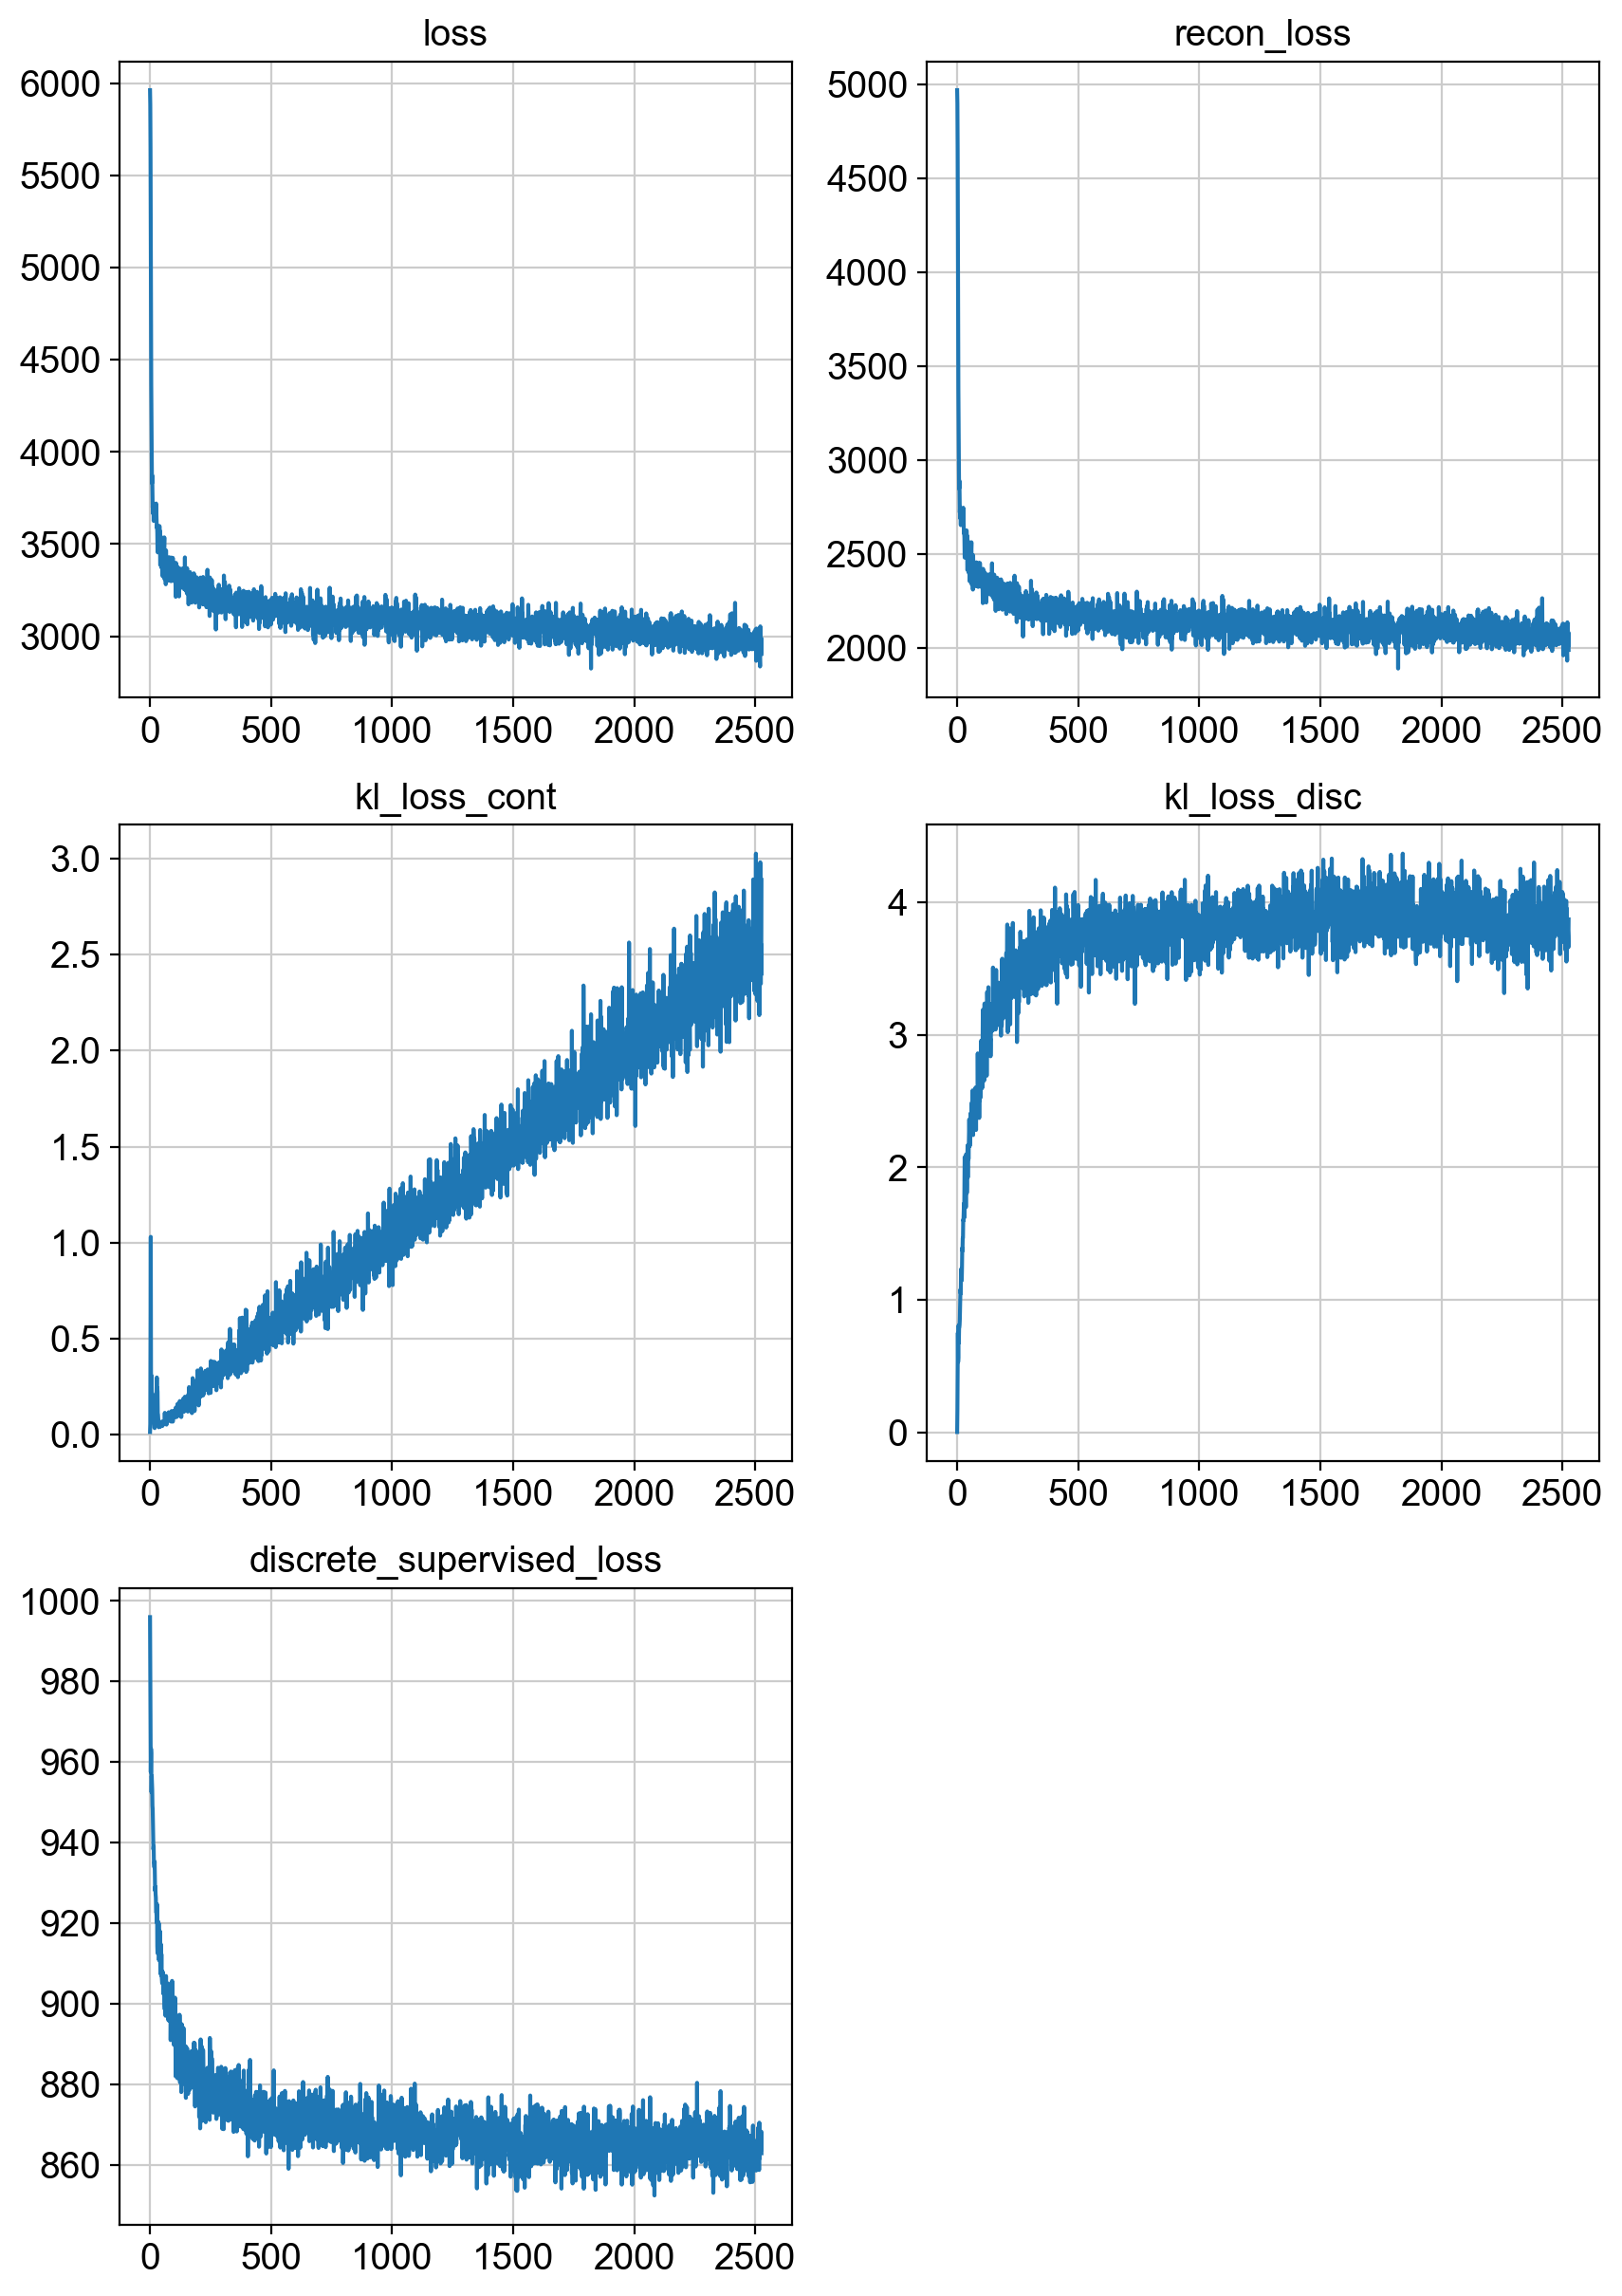
fig = draw_loss_curves(adata.uns['unc_stuffs']['trainer'].losses)
# if save_figs:
#     fig.savefig(os.path.join(savePath, 'img', 'fig1_lossCurves.png'))
fig.show()
In [85]:
scu.embed_unicoord_in_adata(adata, only_sup=True)
In [86]:
adata.obsm['unicoord'].shape
Out[86]:
In [87]:
sc.pp.neighbors(adata, use_rep='unicoord', )
In [88]:
sc.tl.leiden(adata, resolution=0.5)
In [89]:
sc.tl.umap(adata)
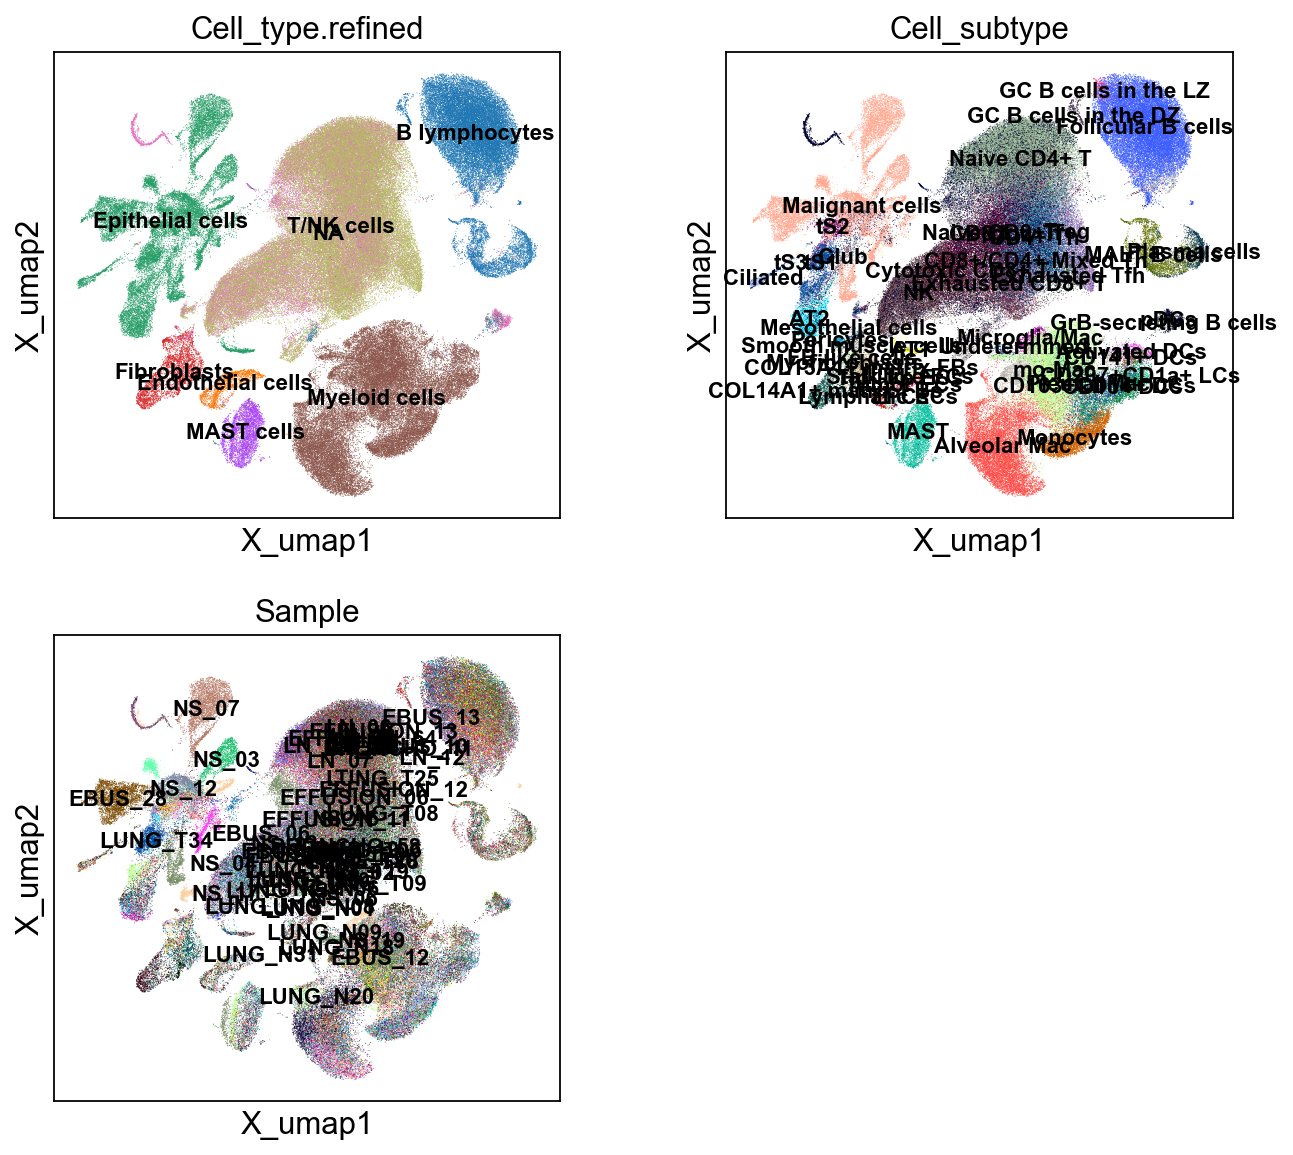
In [12]:
sc.pl.embedding(adata, 'X_umap',legend_loc='on data', legend_fontsize=10,
                color=['Cell_type.refined', 'Cell_subtype','Sample'], ncols=2)
predict test set
In [13]:
bdata = adata[~adata.obs.unc_training,:].copy()
bdata
Out[13]:
In [14]:
scu.predcit_unicoord_in_adata(bdata, adata)
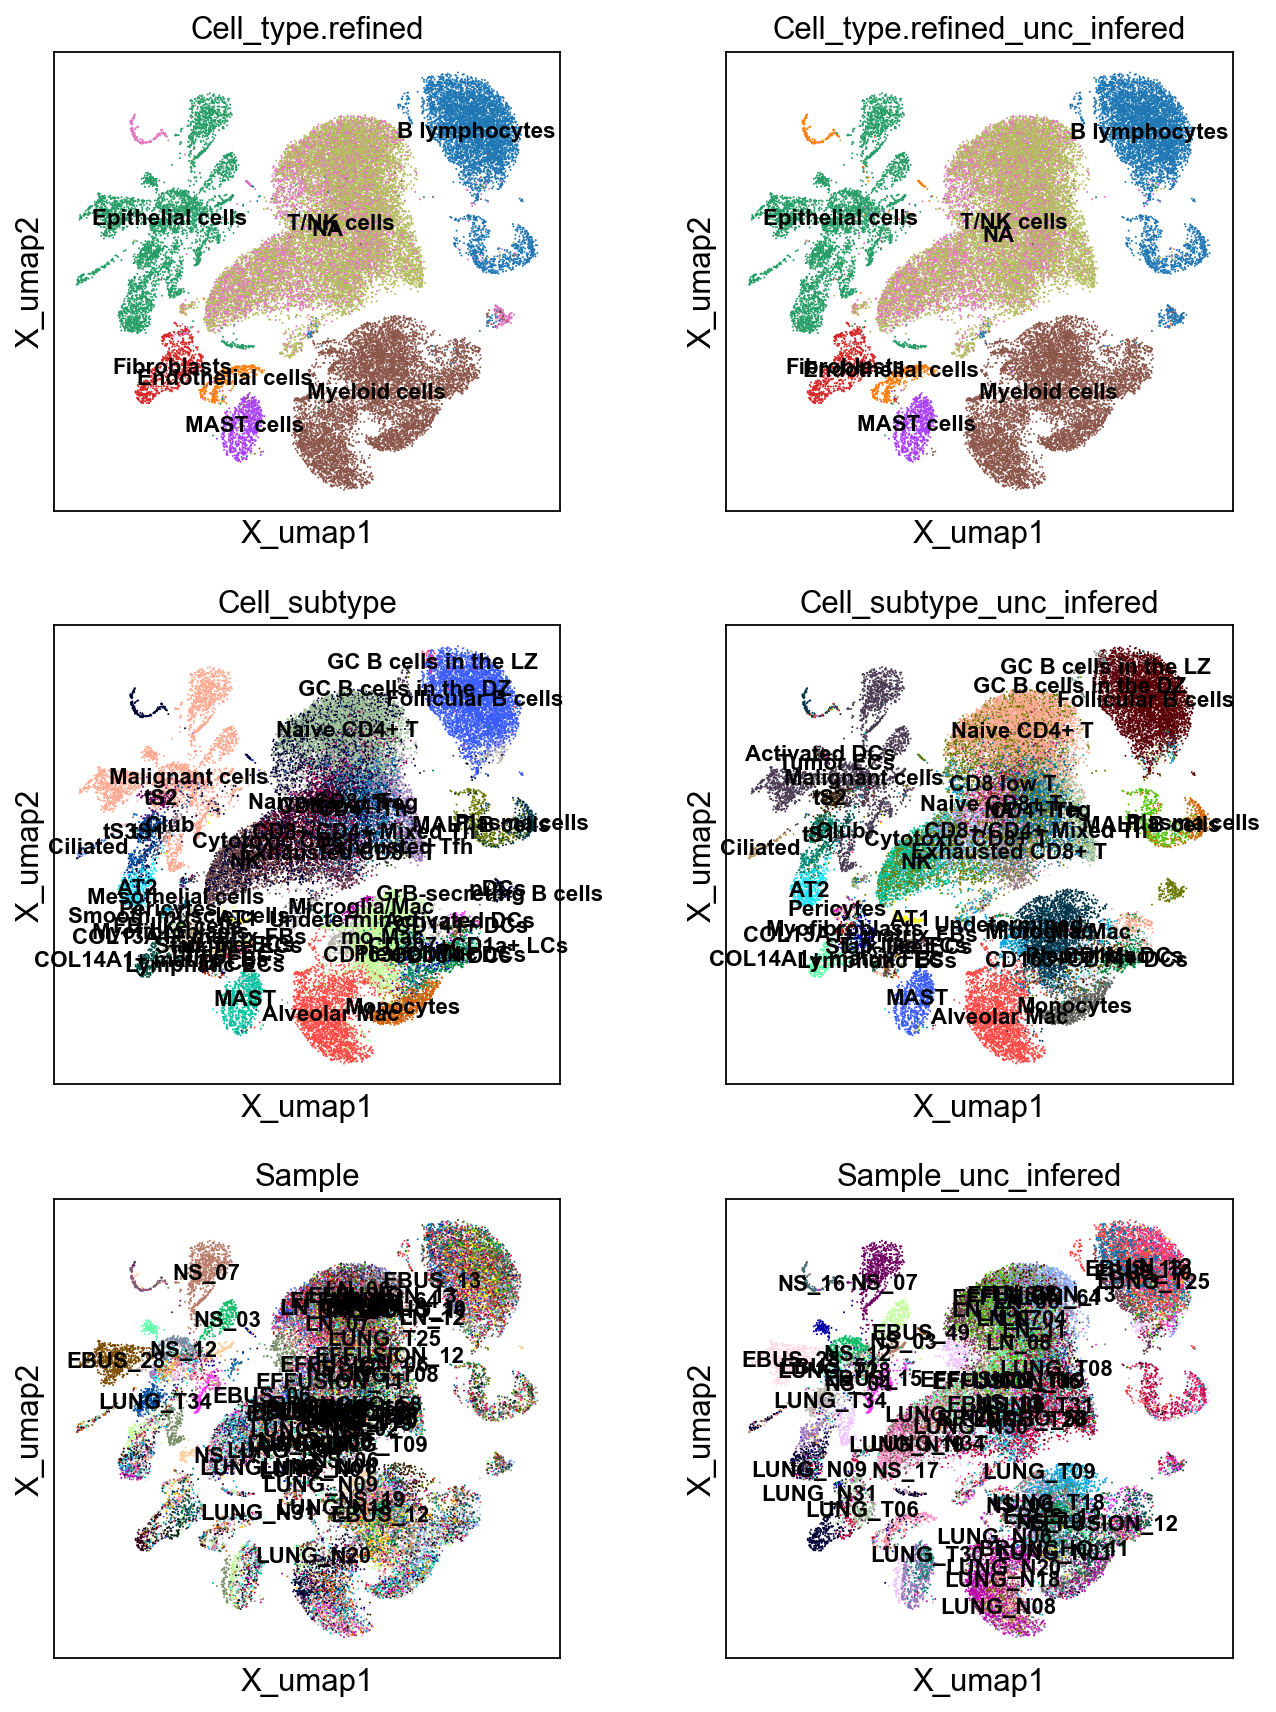
In [16]:
sc.pl.embedding(bdata, 'X_umap',legend_loc='on data', legend_fontsize=10,
                color= ['Cell_type.refined','Cell_type.refined_unc_infered',
                        'Cell_subtype','Cell_subtype_unc_infered',
                        'Sample','Sample_unc_infered'], ncols=2)
predict liver cancer data
In [43]:
cdata = sc.read_h5ad(r'D:\hECA\Liver_cancer.pp.h5ad')
In [44]:
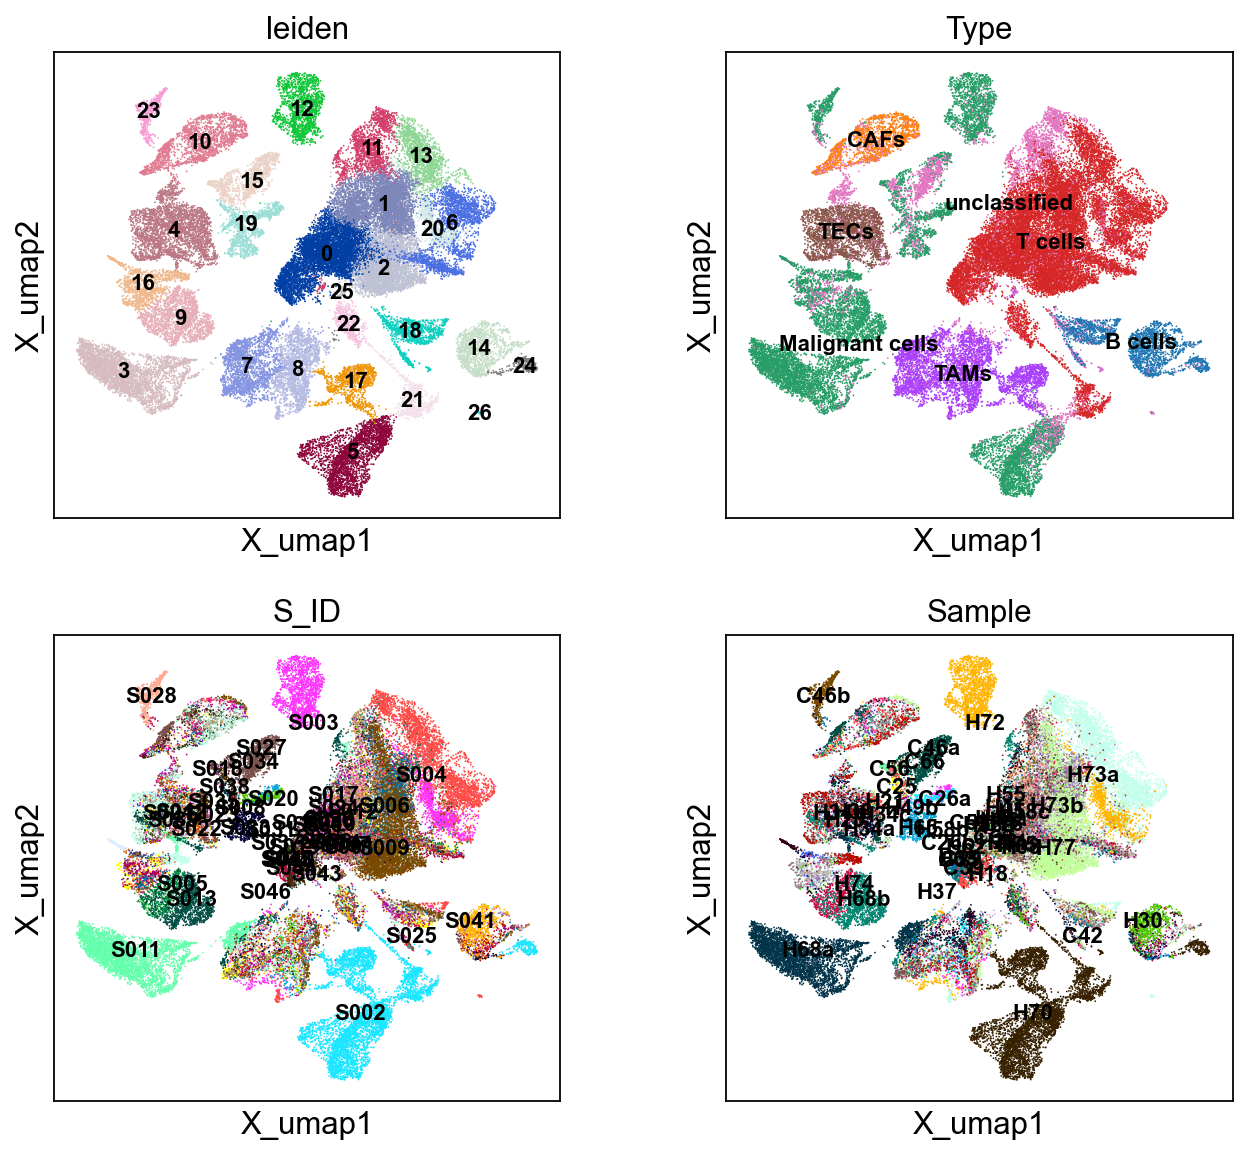
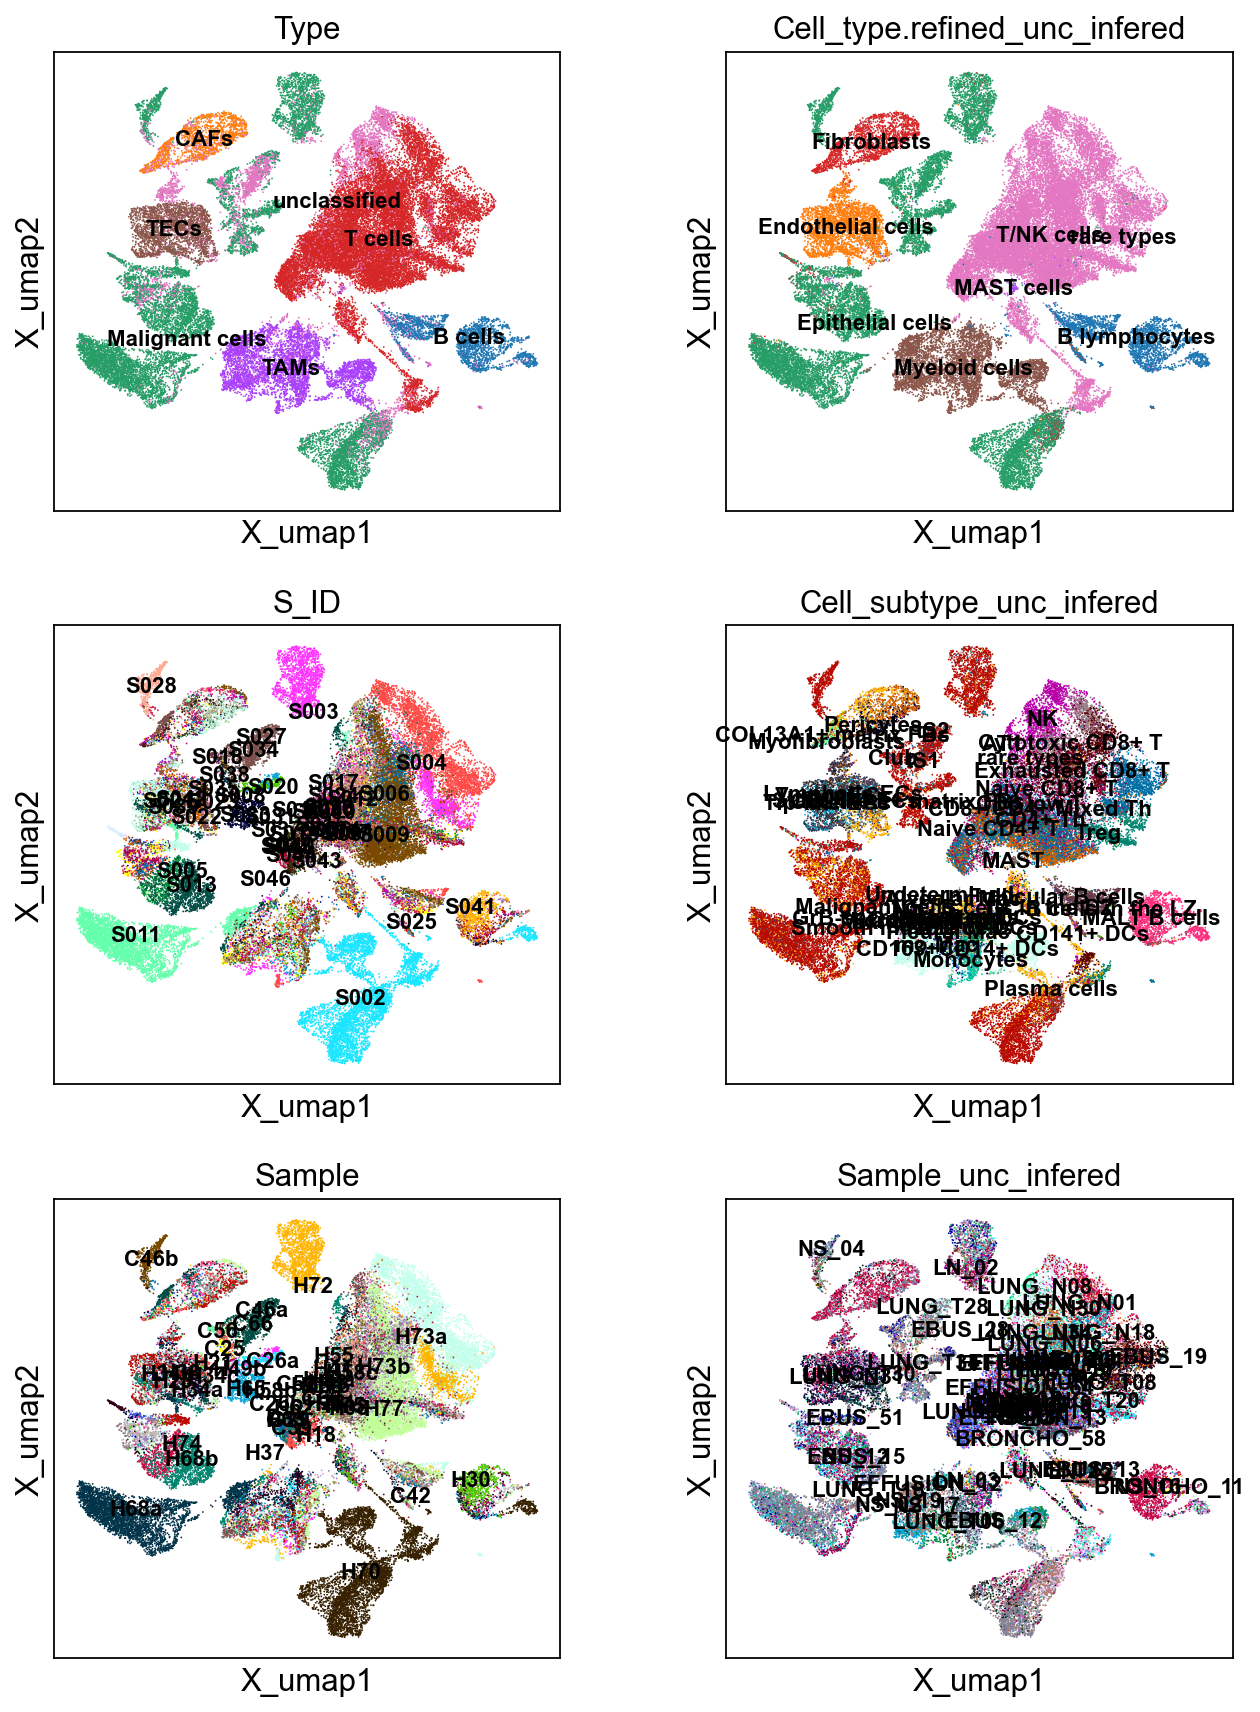
sc.pl.embedding(cdata, 'X_umap',legend_loc='on data', legend_fontsize=10,
                color=['leiden','Type','S_ID','Sample'], ncols=2)
In [45]:
cdata = cdata.raw.to_adata()
sc.pp.normalize_total(cdata, target_sum=1e4 ,exclude_highly_expressed= True)
sc.pp.log1p(cdata)
cdata
Out[45]:
In [48]:
scu.predcit_unicoord_in_adata(cdata, adata, chunk_size=20000)
In [49]:
sc.pl.embedding(cdata, 'X_umap',legend_loc='on data', legend_fontsize=10,
                color= ['Type','Cell_type.refined_unc_infered',
                        'S_ID','Cell_subtype_unc_infered',
                        'Sample','Sample_unc_infered'], ncols=2)
In [50]:
cdata.obs.groupby(['Type', 'Cell_type.refined_unc_infered']).size().unstack()
Out[50]:
predict lung ECA data
In [51]:
cdata = sc.read_h5ad(r'D:\hECA\Lung.Adult.pp.h5ad')
In [52]:
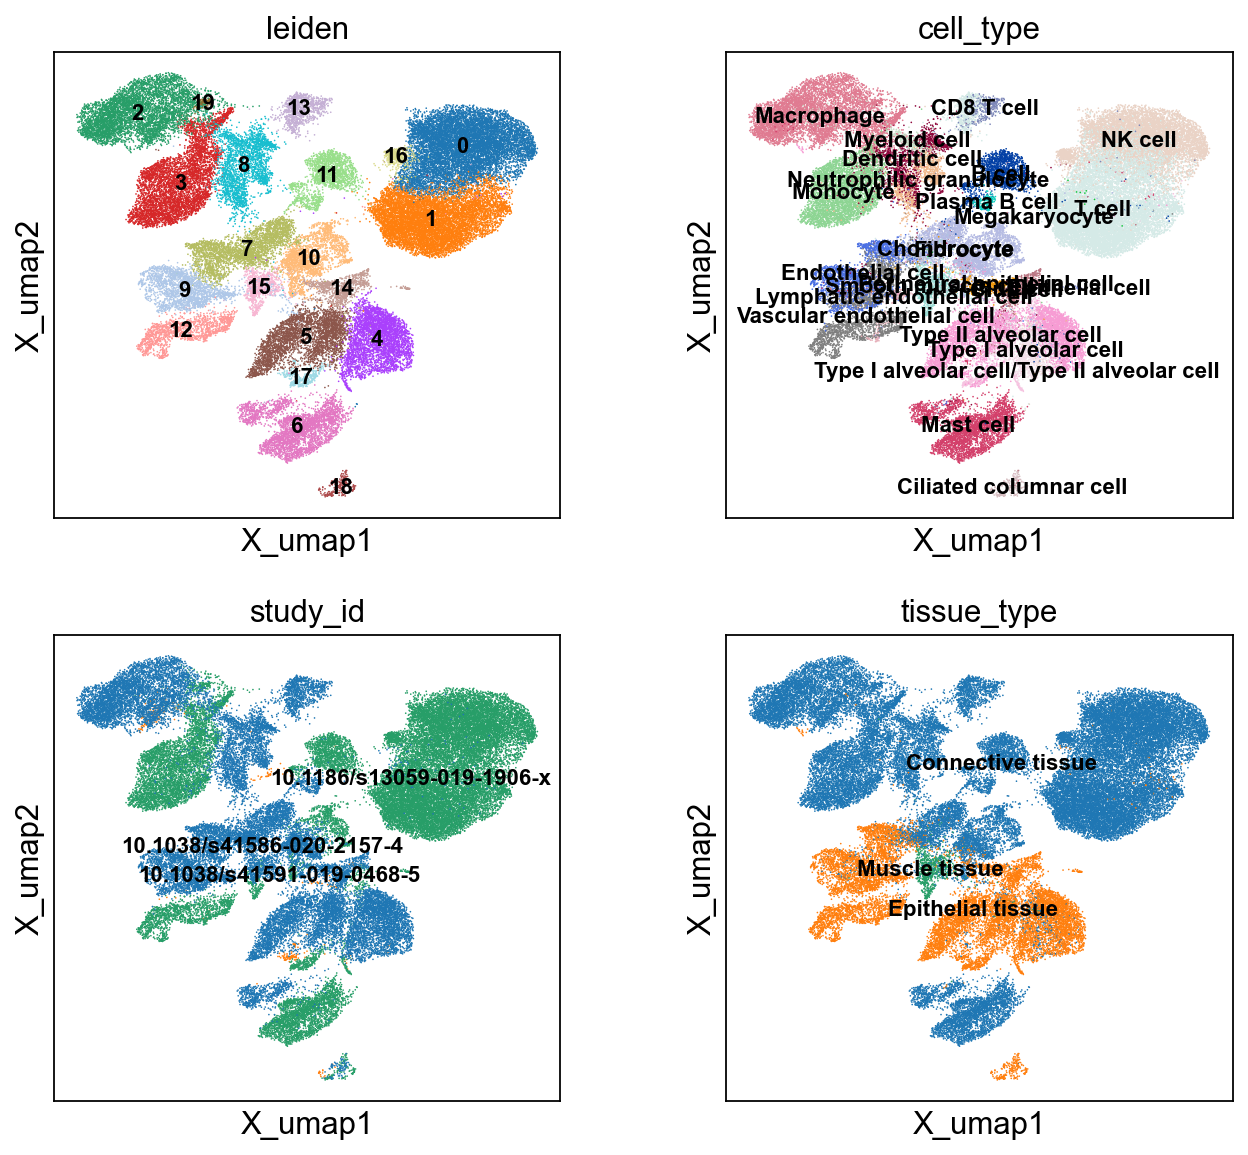
sc.pl.embedding(cdata, 'X_umap',legend_loc='on data', legend_fontsize=10,
                color=['leiden','cell_type','study_id','tissue_type'], ncols=2)
In [53]:
cdata = cdata.raw.to_adata()
sc.pp.normalize_total(cdata, target_sum=1e4 ,exclude_highly_expressed= True)
sc.pp.log1p(cdata)
cdata
Out[53]:
In [54]:
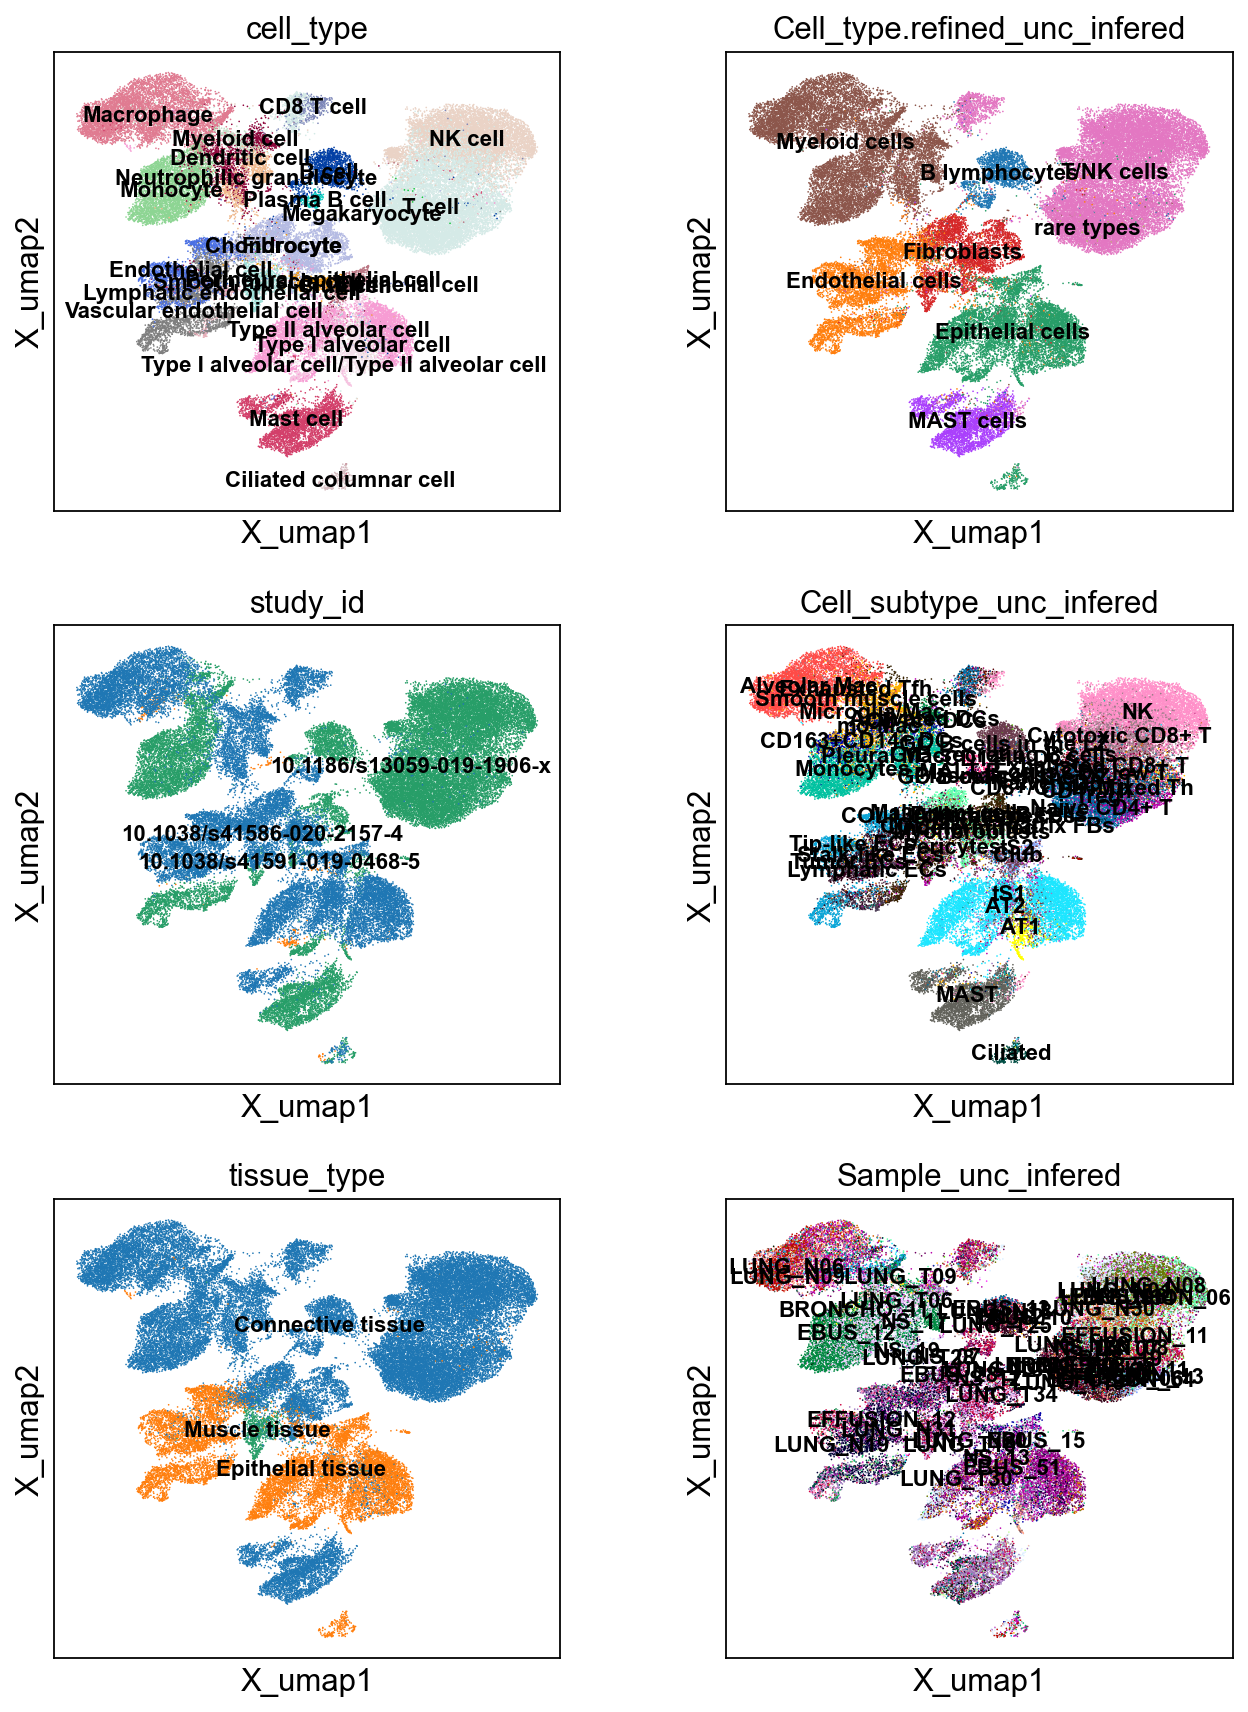
scu.predcit_unicoord_in_adata(cdata, adata)
In [55]:
sc.pl.embedding(cdata, 'X_umap',legend_loc='on data', legend_fontsize=10,
                color= ['cell_type','Cell_type.refined_unc_infered',
                        'study_id','Cell_subtype_unc_infered',
                        'tissue_type','Sample_unc_infered'], ncols=2)
In [58]:
cdata.obs.groupby(['cell_type', 'Cell_type.refined_unc_infered']).size().unstack()
Out[58]:
In [64]:
cdata.obs['Cell_type.refined_unc_infered'].value_counts()
Out[64]:
In [65]:
ct_mapping = {"Type I alveolar cell" : "Epithelial cells",
"Type I alveolar cell/Type II alveolar cell" : "Epithelial cells",
"Type II alveolar cell" : "Epithelial cells",
"Club cell" : "Epithelial cells",
"Ciliated columnar cell" : "Epithelial cells",
"Perineural epithelial cell" : "Epithelial cells",
"Epithelial cell" : "Epithelial cells",
"Lymphatic endothelial cell" : "Endothelial cells",
"Vascular endothelial cell" : "Endothelial cells",
"Endothelial cell" : "Endothelial cells",
"Fibrocyte" : "Fibroblasts",
"Smooth muscle cell" : "Fibroblasts",
"Dendritic cell" : "Myeloid cells",
"Macrophage" : "Myeloid cells",
"Monocyte" : "Myeloid cells",
"Neutrophilic granulocyte" : "Myeloid cells",
"Myeloid cell" : "Myeloid cells",
"Mast cell" : "MAST cells",
"NK cell" : "T/NK cells",
"T cell" : "T/NK cells",
"CD8 T cell" : "T/NK cells",
"B cell" : "B lymphocytes",
"Plasma B cell" : "B lymphocytes",
"Chondrocyte" : "rare types",
"Megakaryocyte" : "rare types"}
In [67]:
ct1 = cdata.obs['Cell_type.refined_unc_infered']
ct2 = [ct_mapping[c] if c in ct_mapping else "rare types" for c in cdata.obs['cell_type']]
In [68]:
from sklearn.metrics import accuracy_score
In [69]:
accuracy_score(ct2, ct1)
Out[69]:
In [62]:
import seaborn as sns
In [61]:
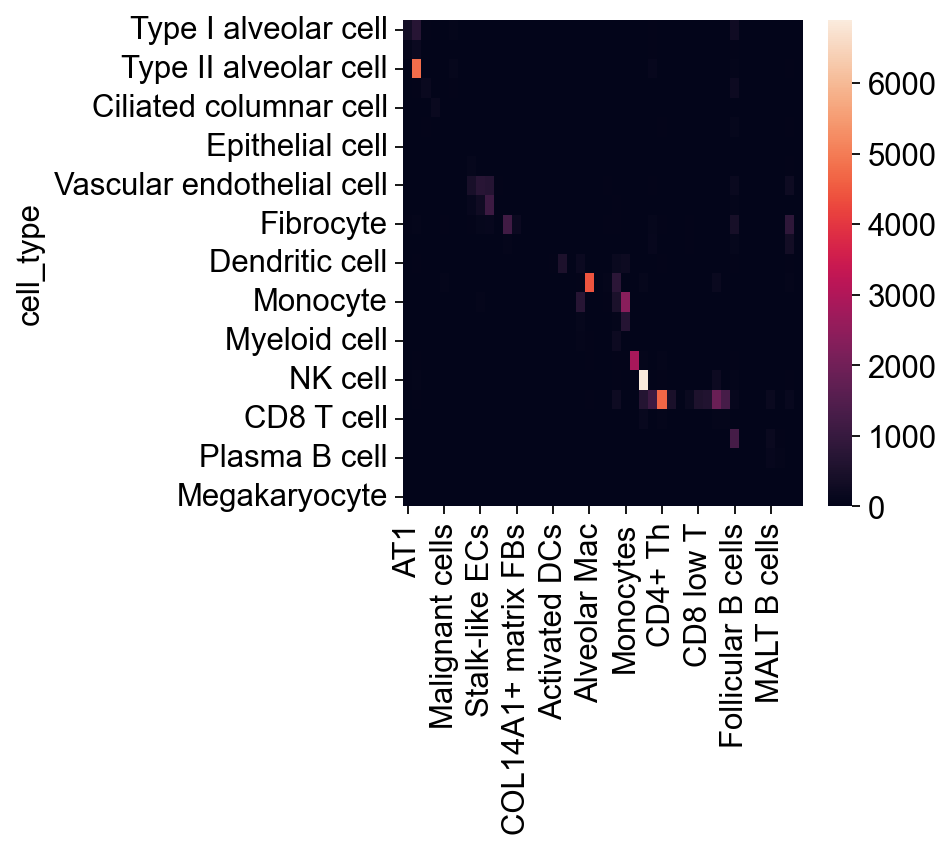
confusion_mtx = pd.read_csv('./table.csv', index_col=0)
In [63]:
hcl = sns.heatmap(confusion_mtx)
In [56]:
cdata.obs.groupby(['cell_type', 'Cell_subtype_unc_infered']).size().unstack().to_csv('./table.csv')
In [57]:
cdata.obs.cell_type.value_counts()
Out[57]: